
Sales Reports
The Sales Reports feature provides insights into your purchasing and sales performance.
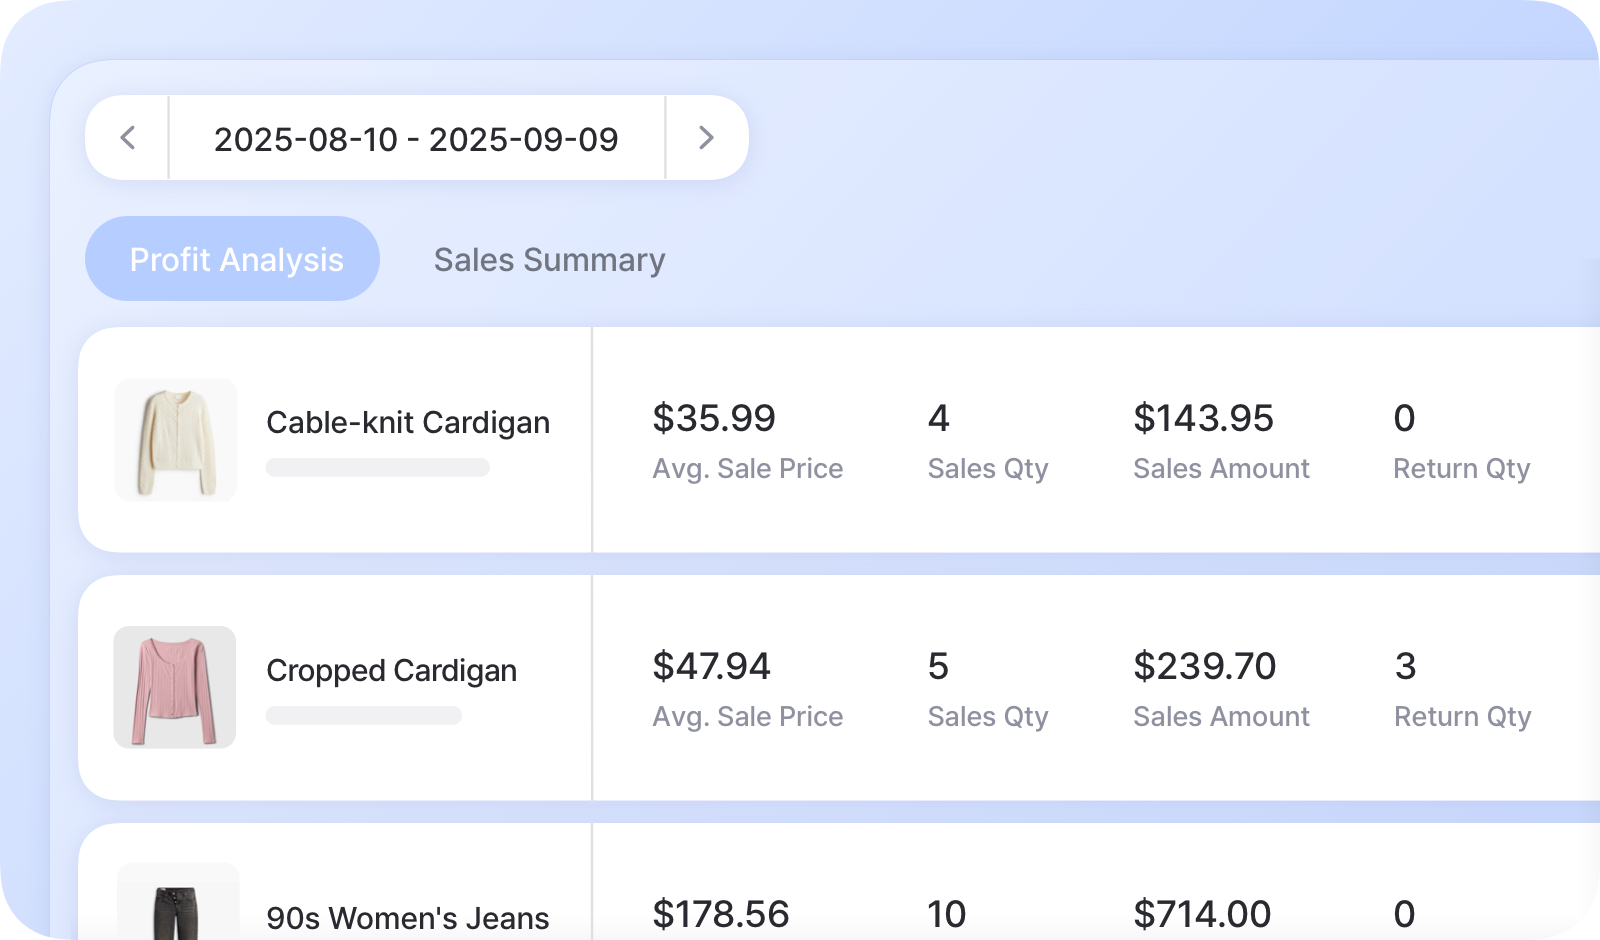
Key Highlights
Section titled “Key Highlights”- Track metrics like average sales price, sales quantity, net profit, and profit rate.
- Compare sales and purchase data to identify trends and opportunities.
- Use data to identify underperforming items and/or adjust pricing accordingly.
Sales Report Tabs
Section titled “Sales Report Tabs”BoxHero organizes sales data through two distinct tabs:
A. Profit Analysis
Section titled “A. Profit Analysis”Your team’s profit is calculated based on all sales orders except drafts (Confirmed, Partially Shipped, and Shipped).
If you only use the Sales feature without recording Purchases, you can still view profit results in this tab.
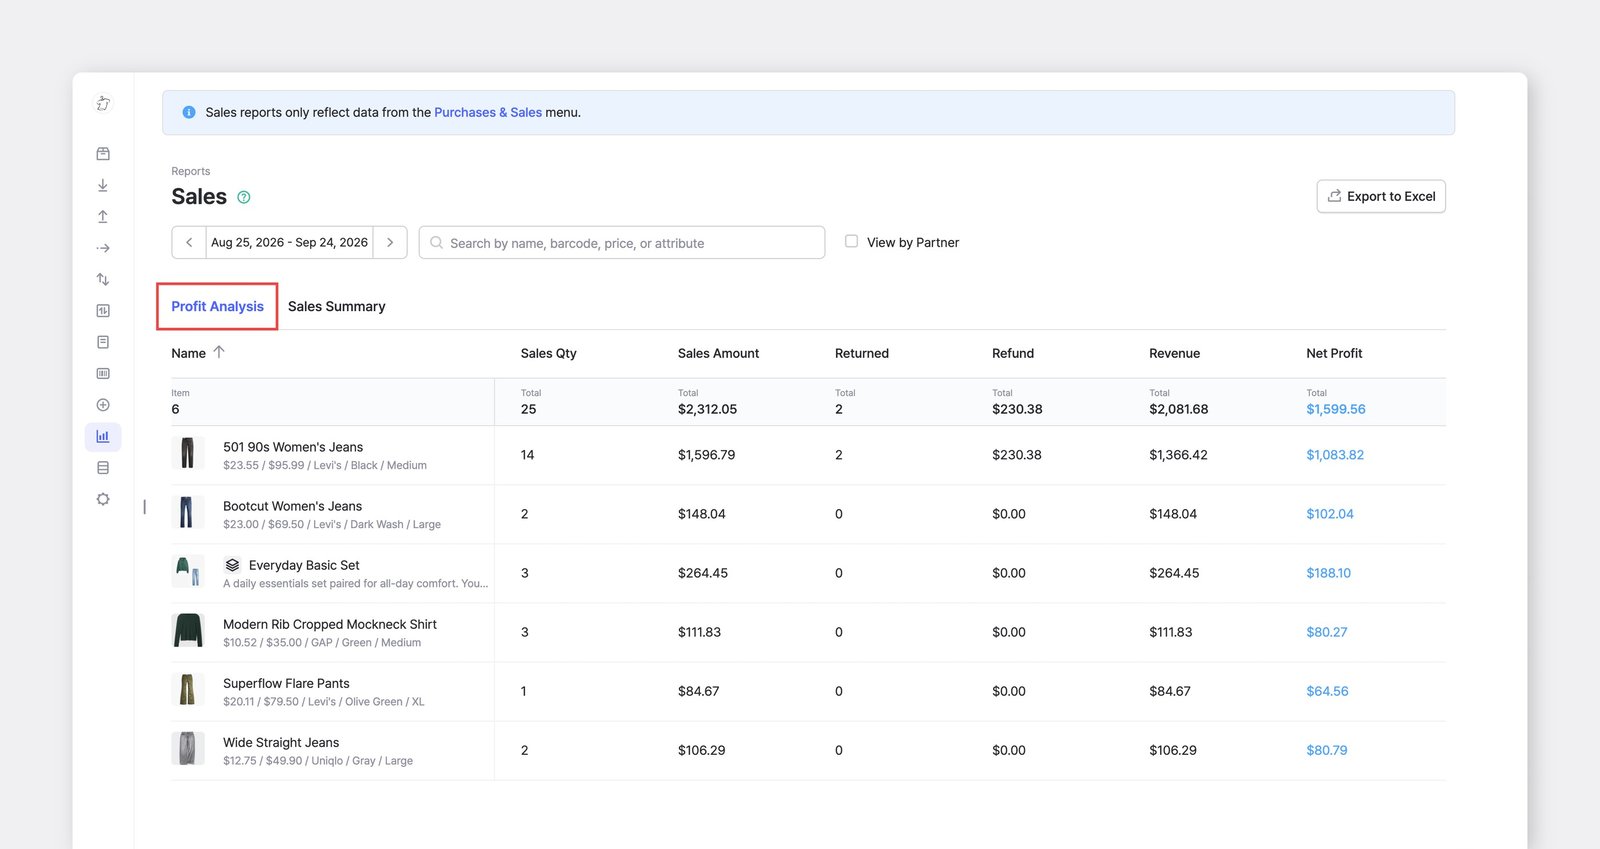
Get insights into your team’s profitability with these key metrics:
| Average Sales Price | Sales amount ÷ Sales quantity |
| Sales Quantity | The total number of items sold. |
| Sales Amount | Sales quantity × Sales price * Sales price is the price listed on the sales order. |
| Return Quantity | The number of items returned, including return requests that haven’t been restocked yet. |
| Refund Amount | Return quantity × Refund price * Refund price is the price listed on the return order. |
| Revenue | Sales amount − Refund amount |
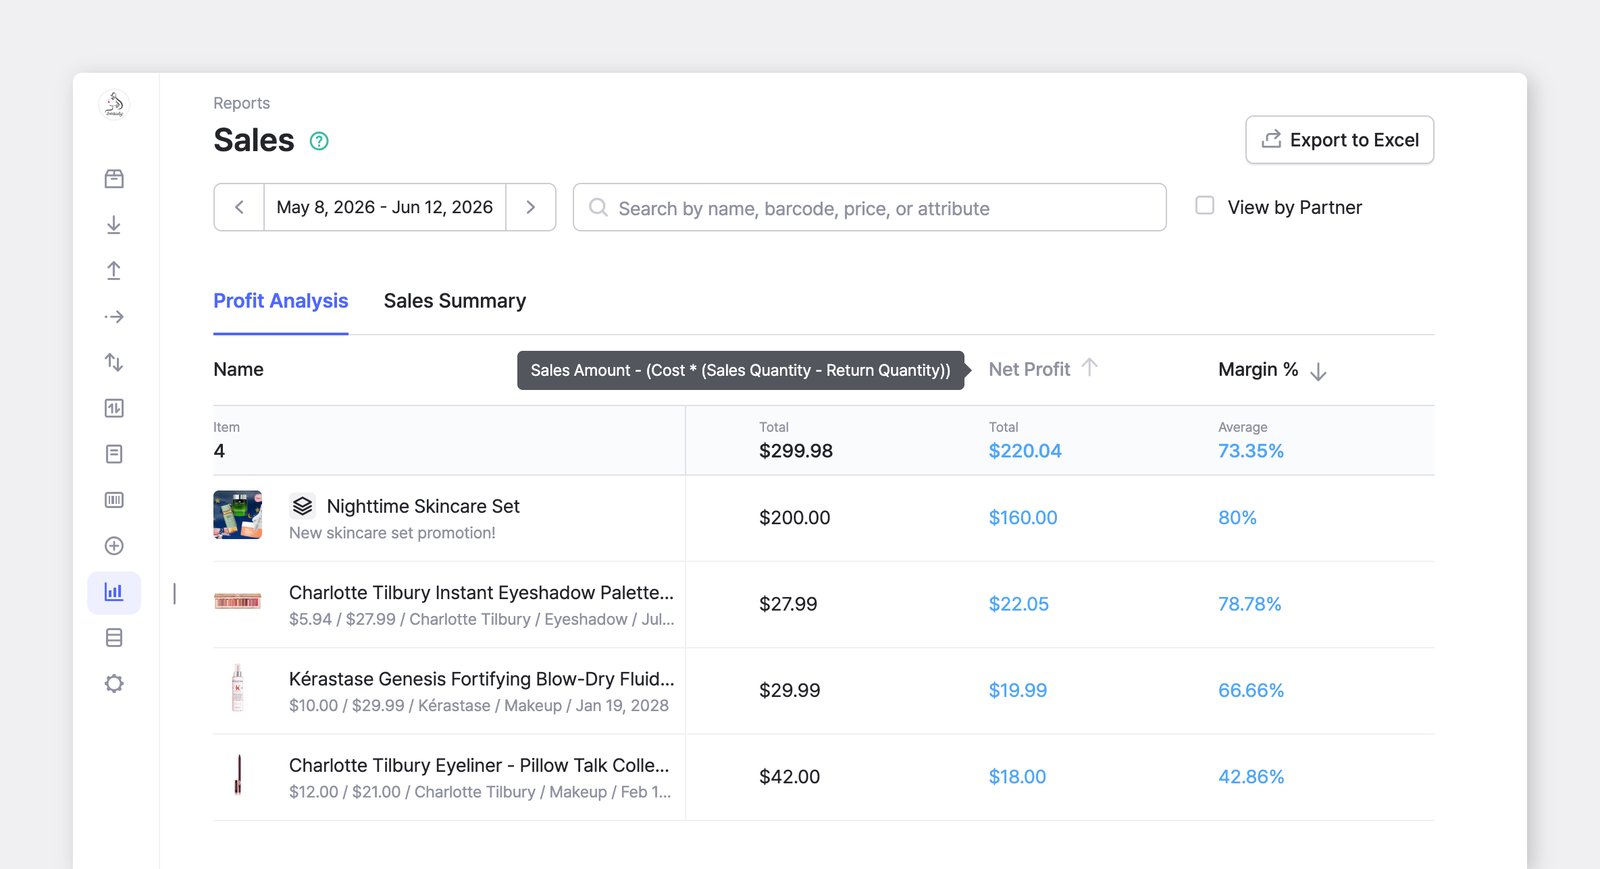
| Net Profit | Revenue − (Cost × (Sales quantity − Return quantity)) * Cost is the purchase price listed in the item details. |
| Margin % | Net profit ÷ Revenue |
B. Sales Summary
Section titled “B. Sales Summary”Sales summary data is calculated based on all purchase orders (POs) and sales orders (SOs) except drafts.
If you use both the Purchases and Sales features, you can view the results in this tab.
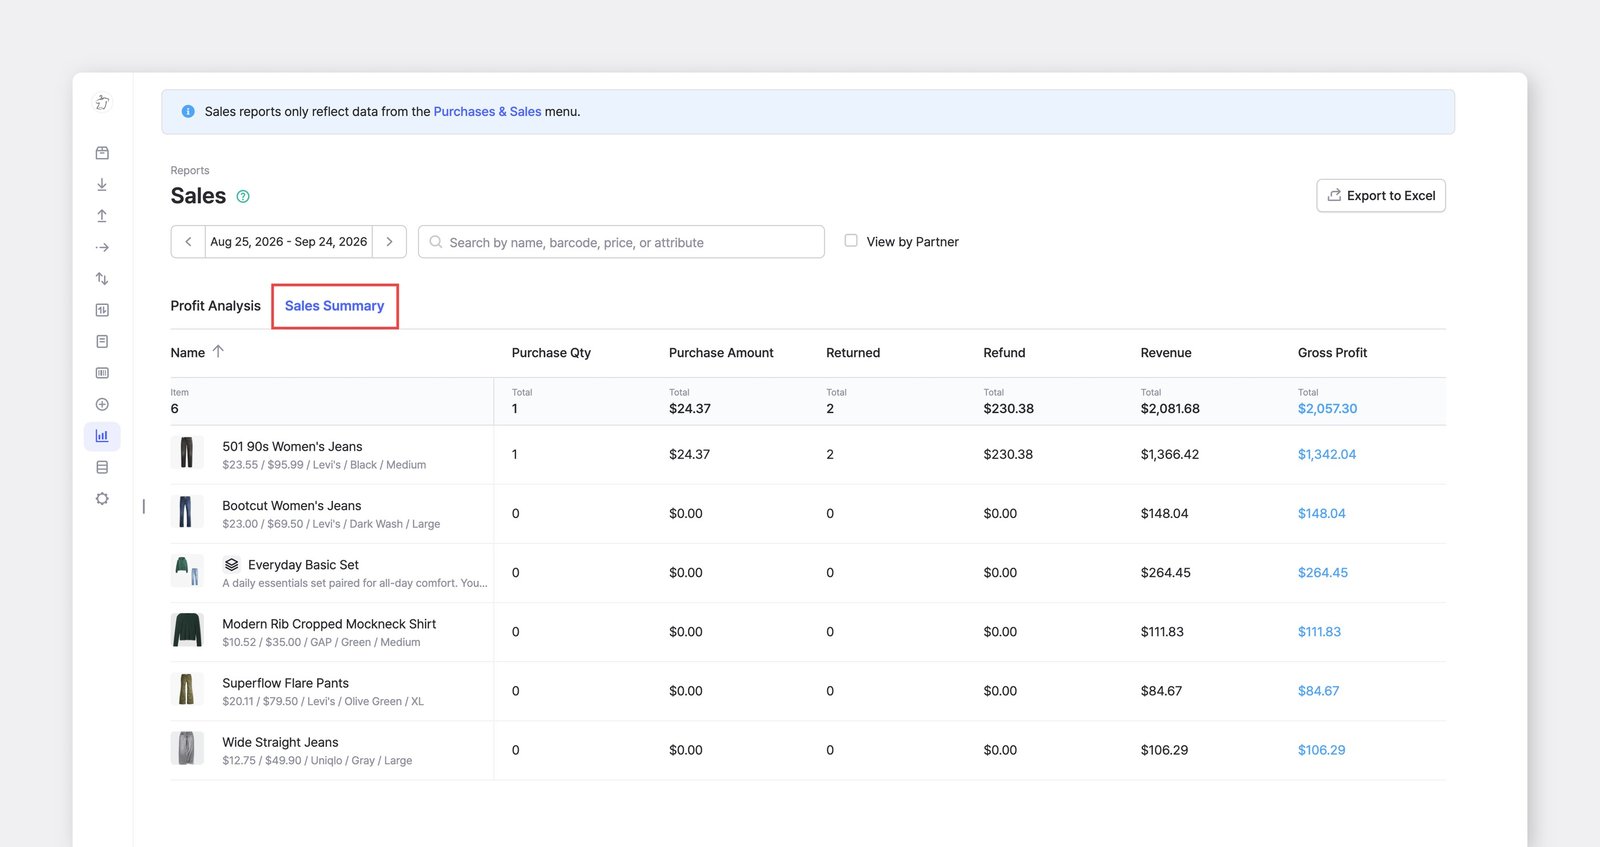
Evaluate your purchase and sales performance with the following metrics:
| Sales Quantity | The total number of items sold. |
| Sales Amount | Sales quantity × Sales price * Sales price is the price listed on the sales order. |
| Purchase Quantity | The total number of items purchased. |
| Purchase Amount | Purchase quantity × Cost * Cost is the price listed on the purchase order. |
| Return Quantity | The number of items returned, including return requests that haven’t been restocked yet. |
| Refund Amount | Return quantity × Refund price * Refund price is the price listed on the return order. |
| Revenue | Sales amount − Refund amount |
| Gross Profit | Revenue − Purchase amount |
Currency and Exchange Rates
Section titled “Currency and Exchange Rates”Sales Reports always display amounts in your team’s current display currency, converting from each order’s currency using the latest exchange rate.
The rate applied appears in the Exchange Rates indicator at the top of the report, labeled with the date and time it was retrieved (for example, “As of Jun 1, 2026 1:00 PM”).
- If an order’s currency matches your display currency, no conversion is applied.
- If an order’s currency differs, its amounts are converted, so figures in the report may not match the raw amounts shown on the order itself.
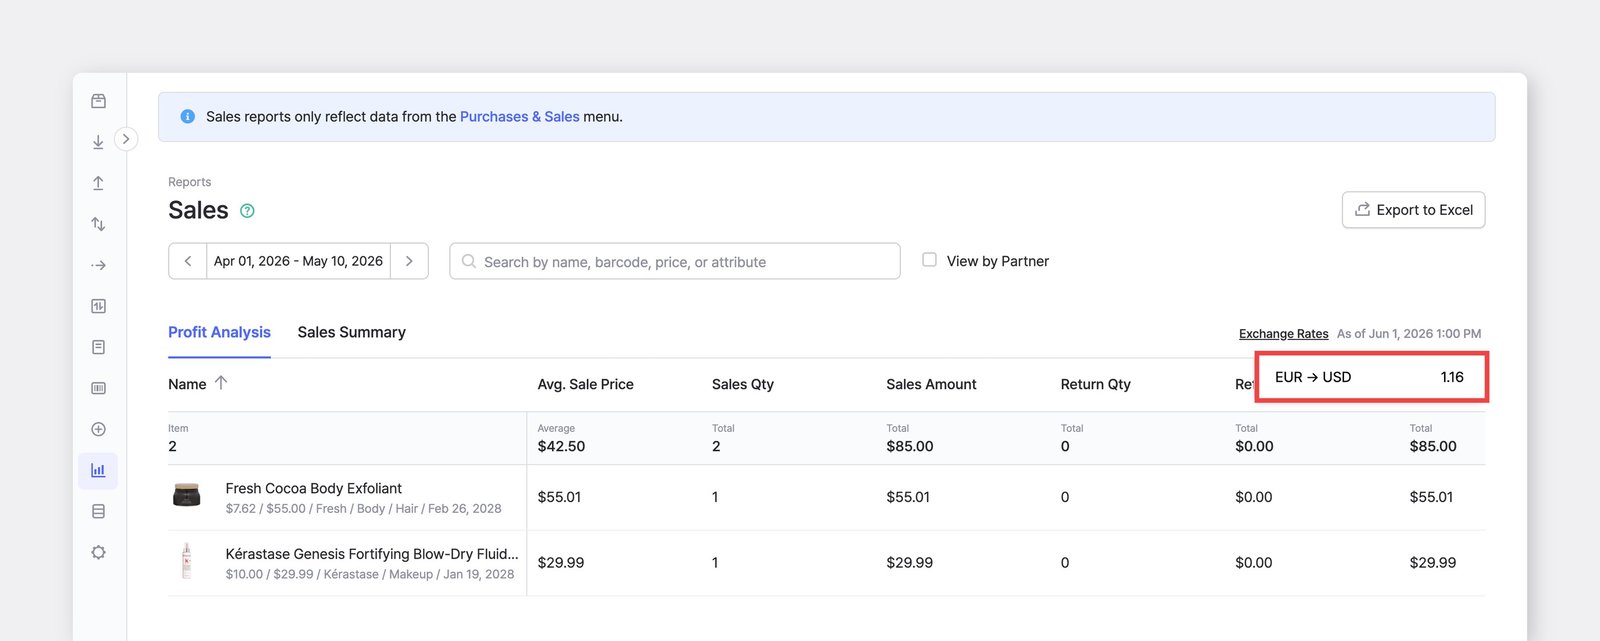
If an item’s amount looks far higher or lower than expected, it’s usually a currency mismatch, not a pricing error. Open the order and confirm it was created in the correct currency.
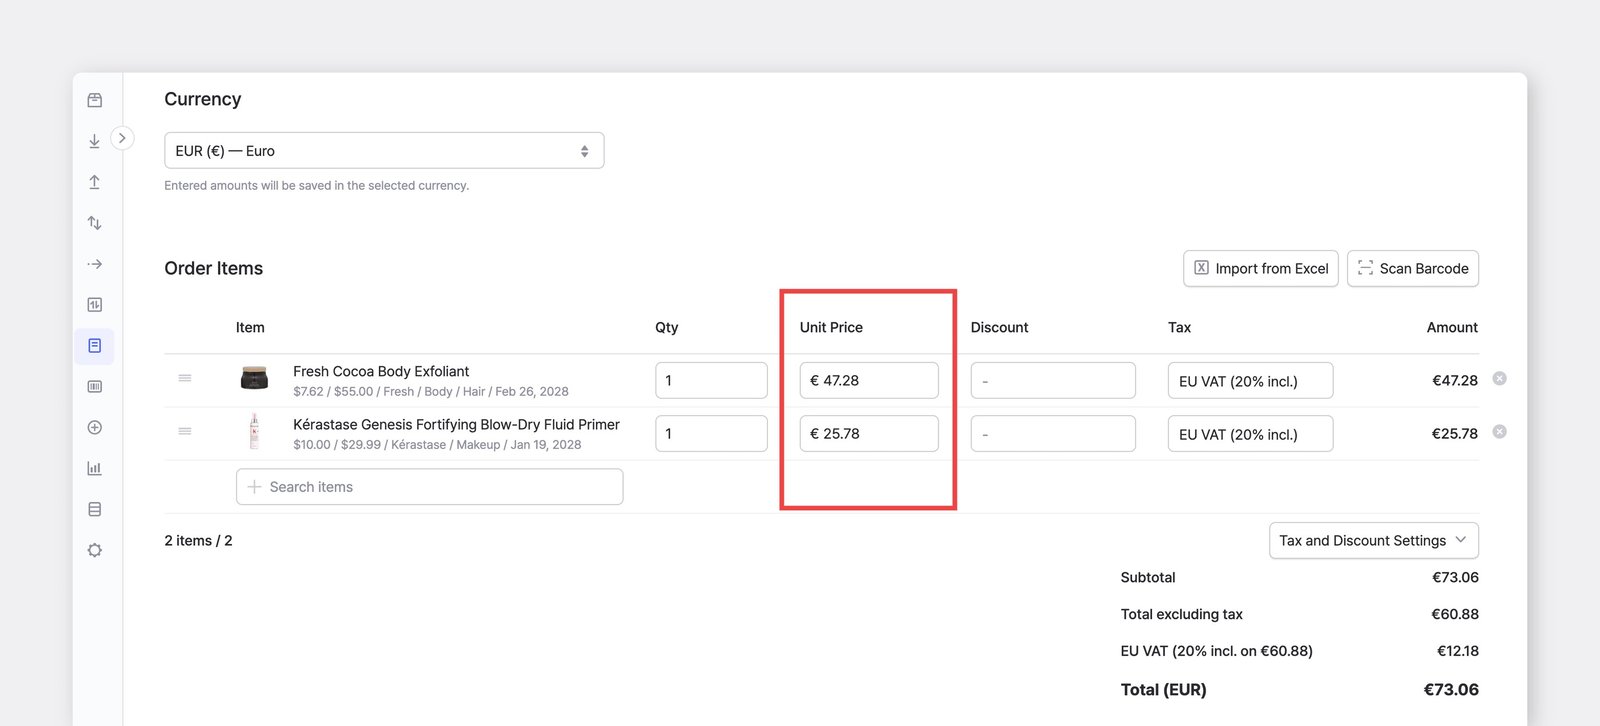
For example, if your display currency is USD and an order was accidentally created in EUR,
its amounts get multiplied by the EUR → USD rate.