How to Use BoxHero’s Reports Feature to Track Key Metrics
BoxHero’s Reports/Analytics feature helps you make sense of your inventory and sales data. With it, you can set up custom reports, run useful calculations, and keep track of important numbers that help you manage your business.
It’s designed to be flexible, so you can calculate the KPIs that matter most to you—whether that’s sales performance, inventory turnover, or profit margins.
In this article, we’ll explain how the Analytics feature works, show you some ready-made formulas you can use right away, and walk through a few examples of creating your own formulas.
Start with Predefined Formulas
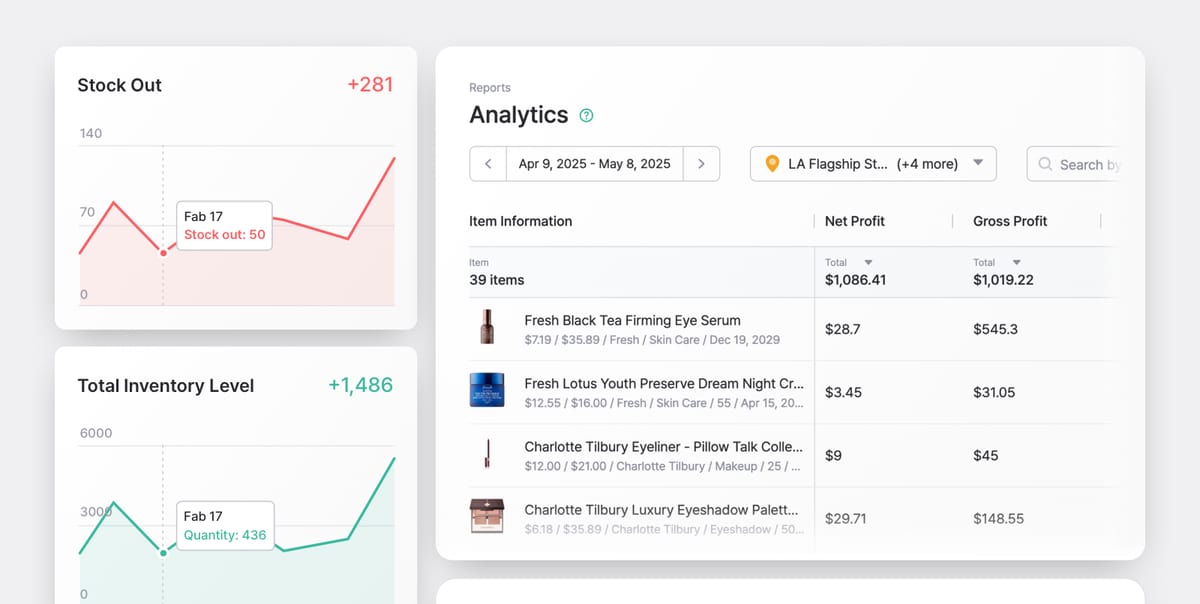
BoxHero makes it easy to get started by offering a range of predefined formulas. These are built-in calculations that give you quick insights without needing to set anything up from scratch. Here are a few examples:
- Total Purchase Amount:
Cost x Total Stock In Quantity - Gross Profit:
(Price - Cost) x Total Stock Out Quantity - Inventory Asset:
Cost x Current Quantity - Reorder Check:
if(Current Quantity < Safety Stock, "Reorder Needed", "-")
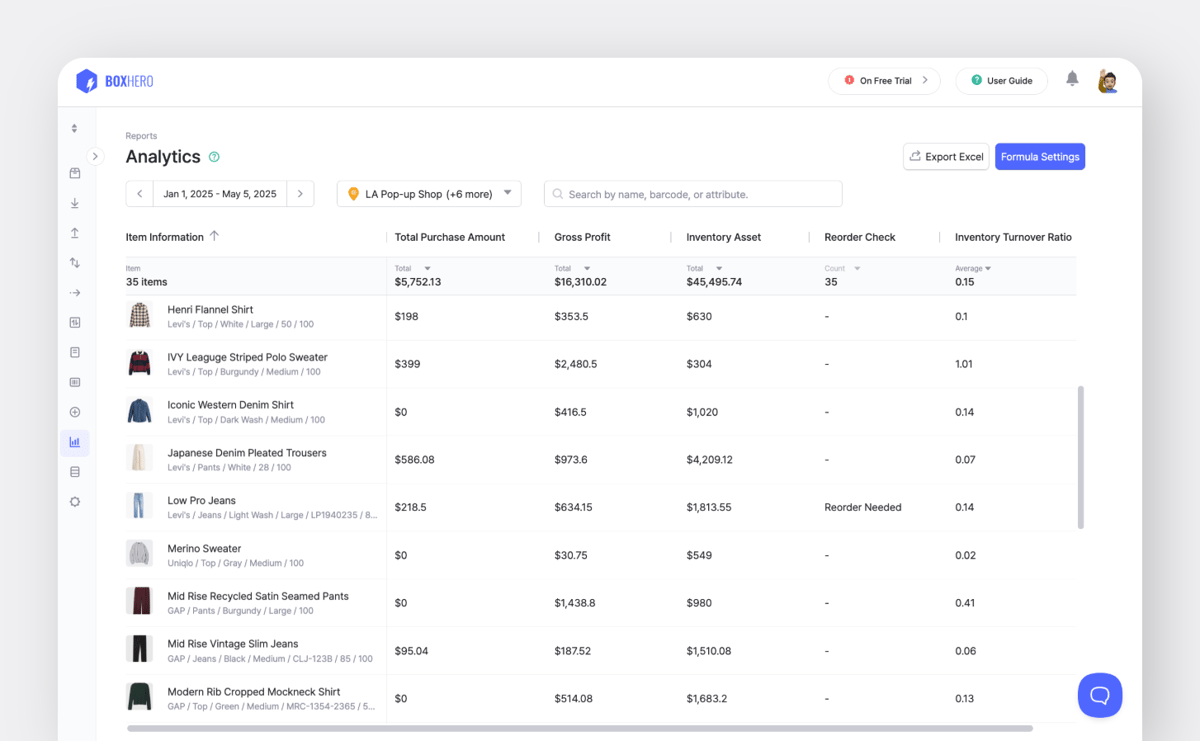
You can apply these formulas in just a few clicks and see useful data right away.
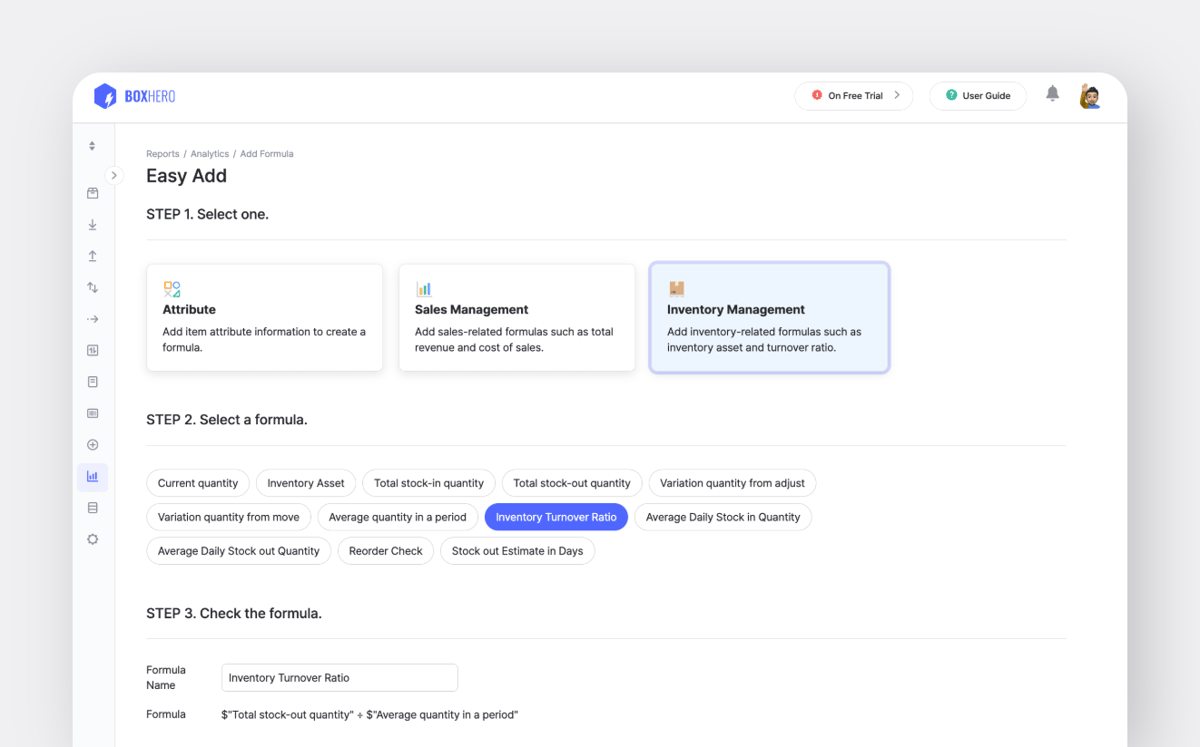
Example: Checking Inventory Turnover
The Inventory Turnover Ratio tells you how often your inventory is selling and being replaced. In BoxHero, you can use this formula:
=
Total Stock Out Quantity ÷ Average Quantity in a PeriodThis number helps you figure out how fast your items are moving and whether you might need to adjust your stock levels.
You can find the full list of available predefined formulas in the link below:

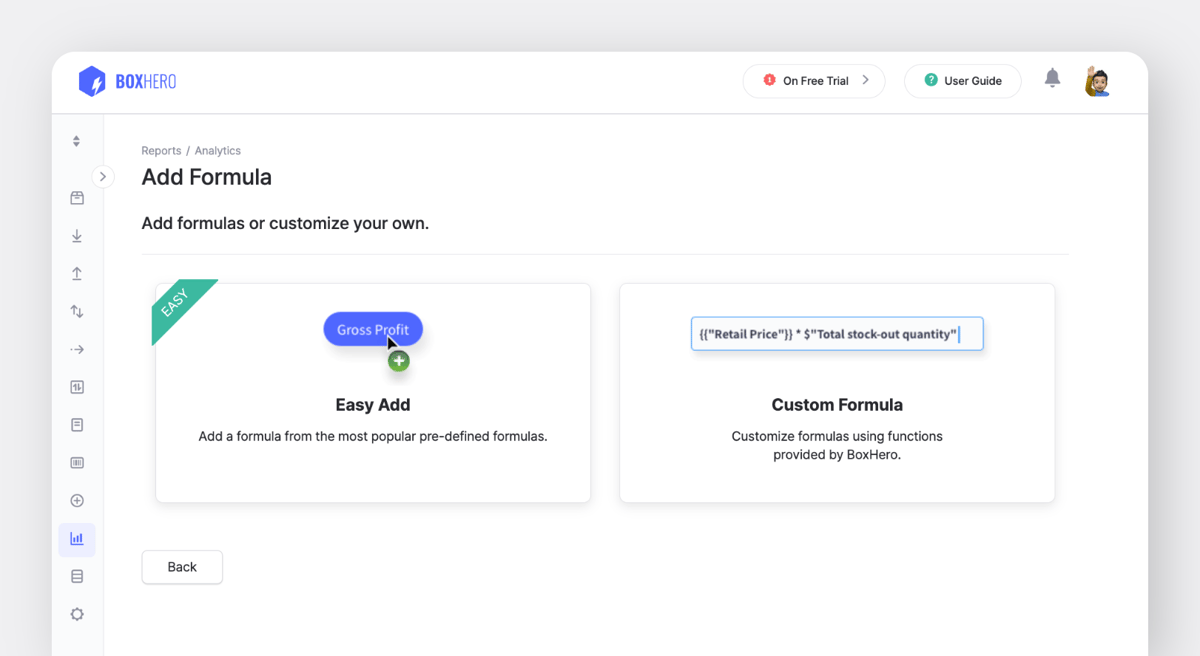
Create Your Own Custom Formulas
If you need to track something specific, BoxHero lets you build your own formulas. The formula editor works a lot like Excel, using basic math symbols and easy functions.
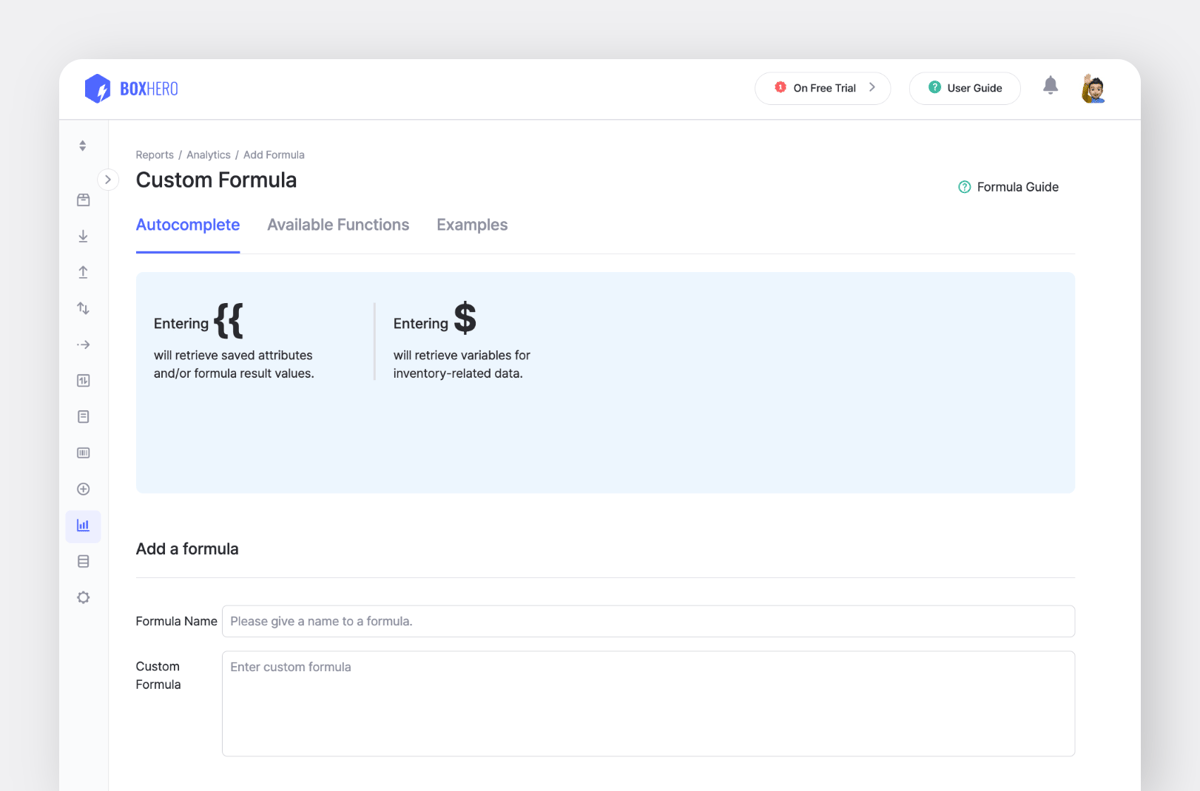
How to Use Variables
$ to find inventory variables like:$CurrentQuantity$TotalStockOutQuantity$NumberOfDays
{{ to use saved item attributes like:{{Weight}}{{Thickness}}{{Capacity}}
"Attributes" are custom fields that can be registered for each item or product in BoxHero. This could include category, brand, size, color, expiration date, and more.
Useful Functions
BoxHero supports the following functions:
+, -, *, /• Conditional statements:
if(condition, value_if_true, value_if_false)• Rounding:
round(), roundUp(), roundDown()• Type conversion:
toNumber(), toString()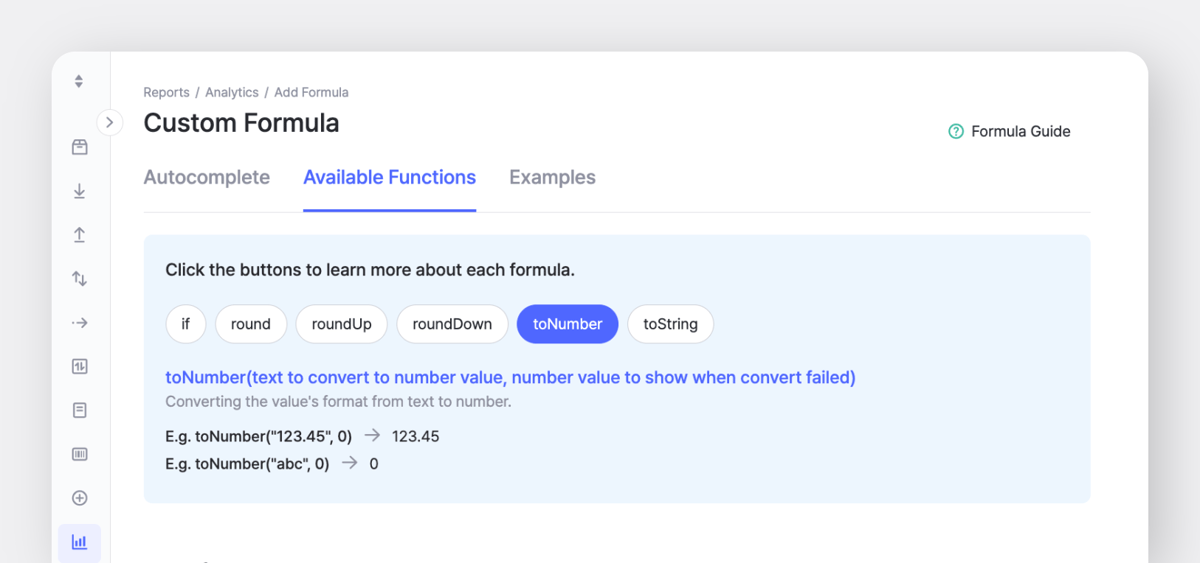
Example: Setting Up a Profit Rate Formula
To see how much profit you make on each sale as a percentage, you can create this formula:
In BoxHero:
- Go to
Reports>Analytics. - Click
Formula Settings>Add Formula>Custom Formula. - Enter:
($Price - $Cost) / $Price
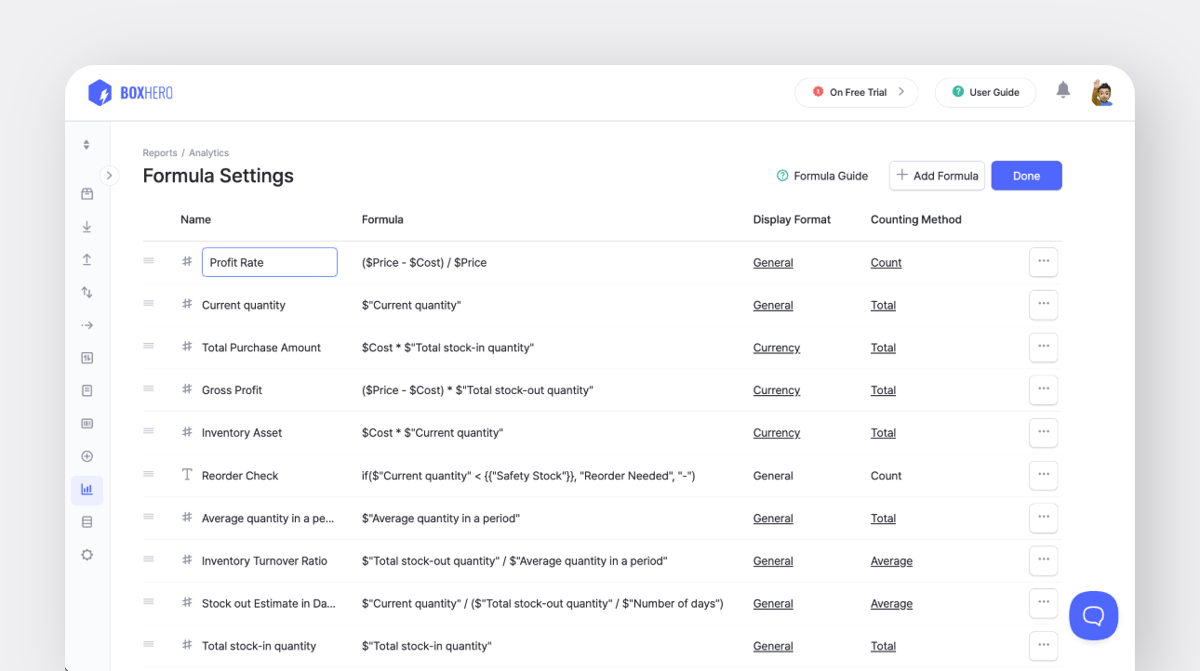
This will show the profit margin for your items.
More Examples
Here are a few more formulas you can try out to track different aspects of your inventory. These examples give you extra ways to monitor stock levels and sales activity.
1. Stock Replenishment Ratio
- Measures how well stock is replenished compared to usage.
($Total Stock-In Quantity) / ($Total Stock-Out Quantity)
2. Stockout Rate
- Percentage of days with at least one stock-out transaction.
($Stock-Out Frequency) / $Number of Days * 100
3. Net Stock Adjustment
- Measures inventory changes due to manual adjustments.
($Increase Quantity from Adjust) - ($Decrease Quantity from Adjust)
4. Net Stock Movement
- Tracks inventory transferred between locations.
($Increase Quantity from Move) - ($Decrease Quantity from Move)
5. Stock Out Impact Factor
- Compares stock-outs to overall inventory movements to assess business impact.
($Stock-Out Frequency) / ($Stock-In Frequency + $Stock-Out Frequency) * 100
6. Stock Variance Ratio
- Tracks fluctuations in stock levels due to adjustments.
($Variation Quantity from Adjust) / $Initial Quantity in a Period * 100
7. Days Since Last Stock-In
- Estimates how long it's been since the last stock-in event.
($Number of Days) - ($Stock-In Frequency)
8. Days Since Last Stock-Out
- Tracks time since the last outbound transaction.
($Number of Days) - ($Stock-Out Frequency)
9. Stock Retention Ratio
- Indicates how much stock remains from the start of a period.
($Final Quantity in a Period) / ($Initial Quantity in a Period) * 100
10. Track Daily Average Stock In and Stock Out
To see daily averages, you can use:
- Daily Average Stock In:
Total Stock In Quantity ÷ Number of Days - Daily Average Stock Out:
Total Stock Out Quantity ÷ Number of Days
These numbers are useful for spotting patterns over time.
Common Questions
How do I calculate my total inventory value?
Go to Reports > Analytics > Formula Settings and select Inventory Asset from the predefined formulas.
How do I track total sales?
Add the Total Sales Amount formula:Price x Total Stock Out Quantity.
How can I check which items need to be reordered?
Use the Reorder Check formula.
It shows "Reorder Needed" when stock is below your safety level.
What happens when I change costs or prices?
The Analytics feature uses the current cost and price for its calculations. If you update these values, past reports will reflect the new numbers.
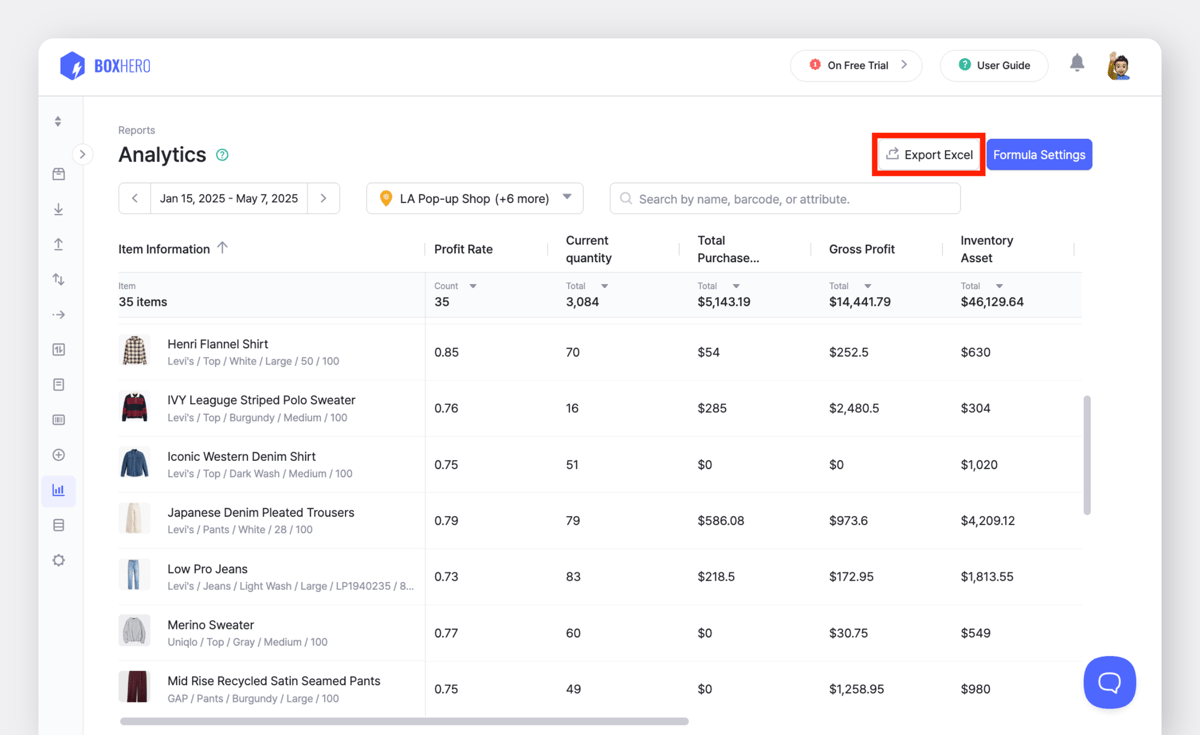
To keep a record of old data, you can export your reports regularly or use the Purchase & Sales feature.

Get More from Your Inventory Data
BoxHero’s Analytics feature helps you stay on top of your inventory and sales. Whether you use the ready-made formulas or create your own, it’s a simple way to keep track of the numbers that matter to your business.
Want to try it out? Start your free 30-day trial today.
RELATED POSTS