What Is a Good Inventory-to-Sales Ratio? (With Current Benchmarks)

A business can have its best sales month of the year and still come up short on cash. Inventory is often part of the reason. Money spent on stock leaves your account the day you pay the supplier, but it only comes back when that stock sells (and for some products, that takes months).
The inventory-to-sales ratio puts a number on this by showing how many months of sales you're holding in stock. For U.S. manufacturers, wholesalers, and retailers combined, that number was 1.30 in July 2026, down from 1.37 a year earlier. Of course, that average lumps together everything from grocery stores to manufacturers, so your own number could look quite different.
A good ratio is one that stays close to your sector's average and holds steady from month to month. In this article, we'll cover how to calculate your inventory-to-sales ratio, how it relates to turnover and days of inventory, and how to compare your result with current benchmarks.
Calculate Your Inventory-to-Sales Ratio
The inventory-to-sales ratio divides the value of inventory on hand at the end of a period by the sales recorded during that period.* Official statistics use one month as the period. Statistics Canada describes the result as "the number of months it would take to sell through current inventory if sales stayed at their current level."

Let's say a hardware distributor that ends March with $180,000 of inventory valued at cost after $120,000 in net sales for the month. Dividing 180,000 by 120,000 gives a ratio of 1.5, so the distributor is holding about one and a half months of sales in stock.
Measure the Same Way Every Month
The ratio is most useful when you track it over time, so both inputs need to be measured consistently.
- Inventory value: Stick to one valuation method and take the figure on the last day of the month. Most small businesses value inventory at cost, which is close to how the national figures are reported.
- Sales: Use net sales (after returns and discounts) for the month that ends on your inventory date.

Connect to Turnover and Days of Inventory
The inventory-to-sales ratio, inventory turnover, and days of inventory all describe the same relationship between stock and sales, but each one expresses it in a different unit.
| Measure | Formula | Result |
|---|---|---|
| Inventory-to-sales ratio Monthly |
Month-end inventory ÷ monthly sales | Months of sales on hand |
| Inventory turnover Annual |
Cost of goods sold ÷ average inventory | Times inventory was sold and replaced |
| Days of inventory Annual |
365 ÷ inventory turnover | Days a typical item stays in stock |
Convert the Ratio Into Days and Turns
Multiply a monthly inventory-to-sales ratio by 30.4 (the average number of days in a month) to estimate days of sales on hand. Divide 12 by the ratio to estimate how many times a year inventory turns over at sales value.
| Inventory-to-sales ratio | Days of sales on hand | Annual turns |
|---|---|---|
| 0.75 | 23 | 16.0 |
| 1.00 | 30 | 12.0 |
| 1.30 | 40 | 9.2 |
| 1.50 | 46 | 8.0 |
| 2.00 | 61 | 6.0 |
| 2.50 | 76 | 4.8 |
Figures are approximate. Annual turns are calculated at sales value, so turnover based on cost of goods sold will be lower.
Account for the Difference Between Sales and Cost
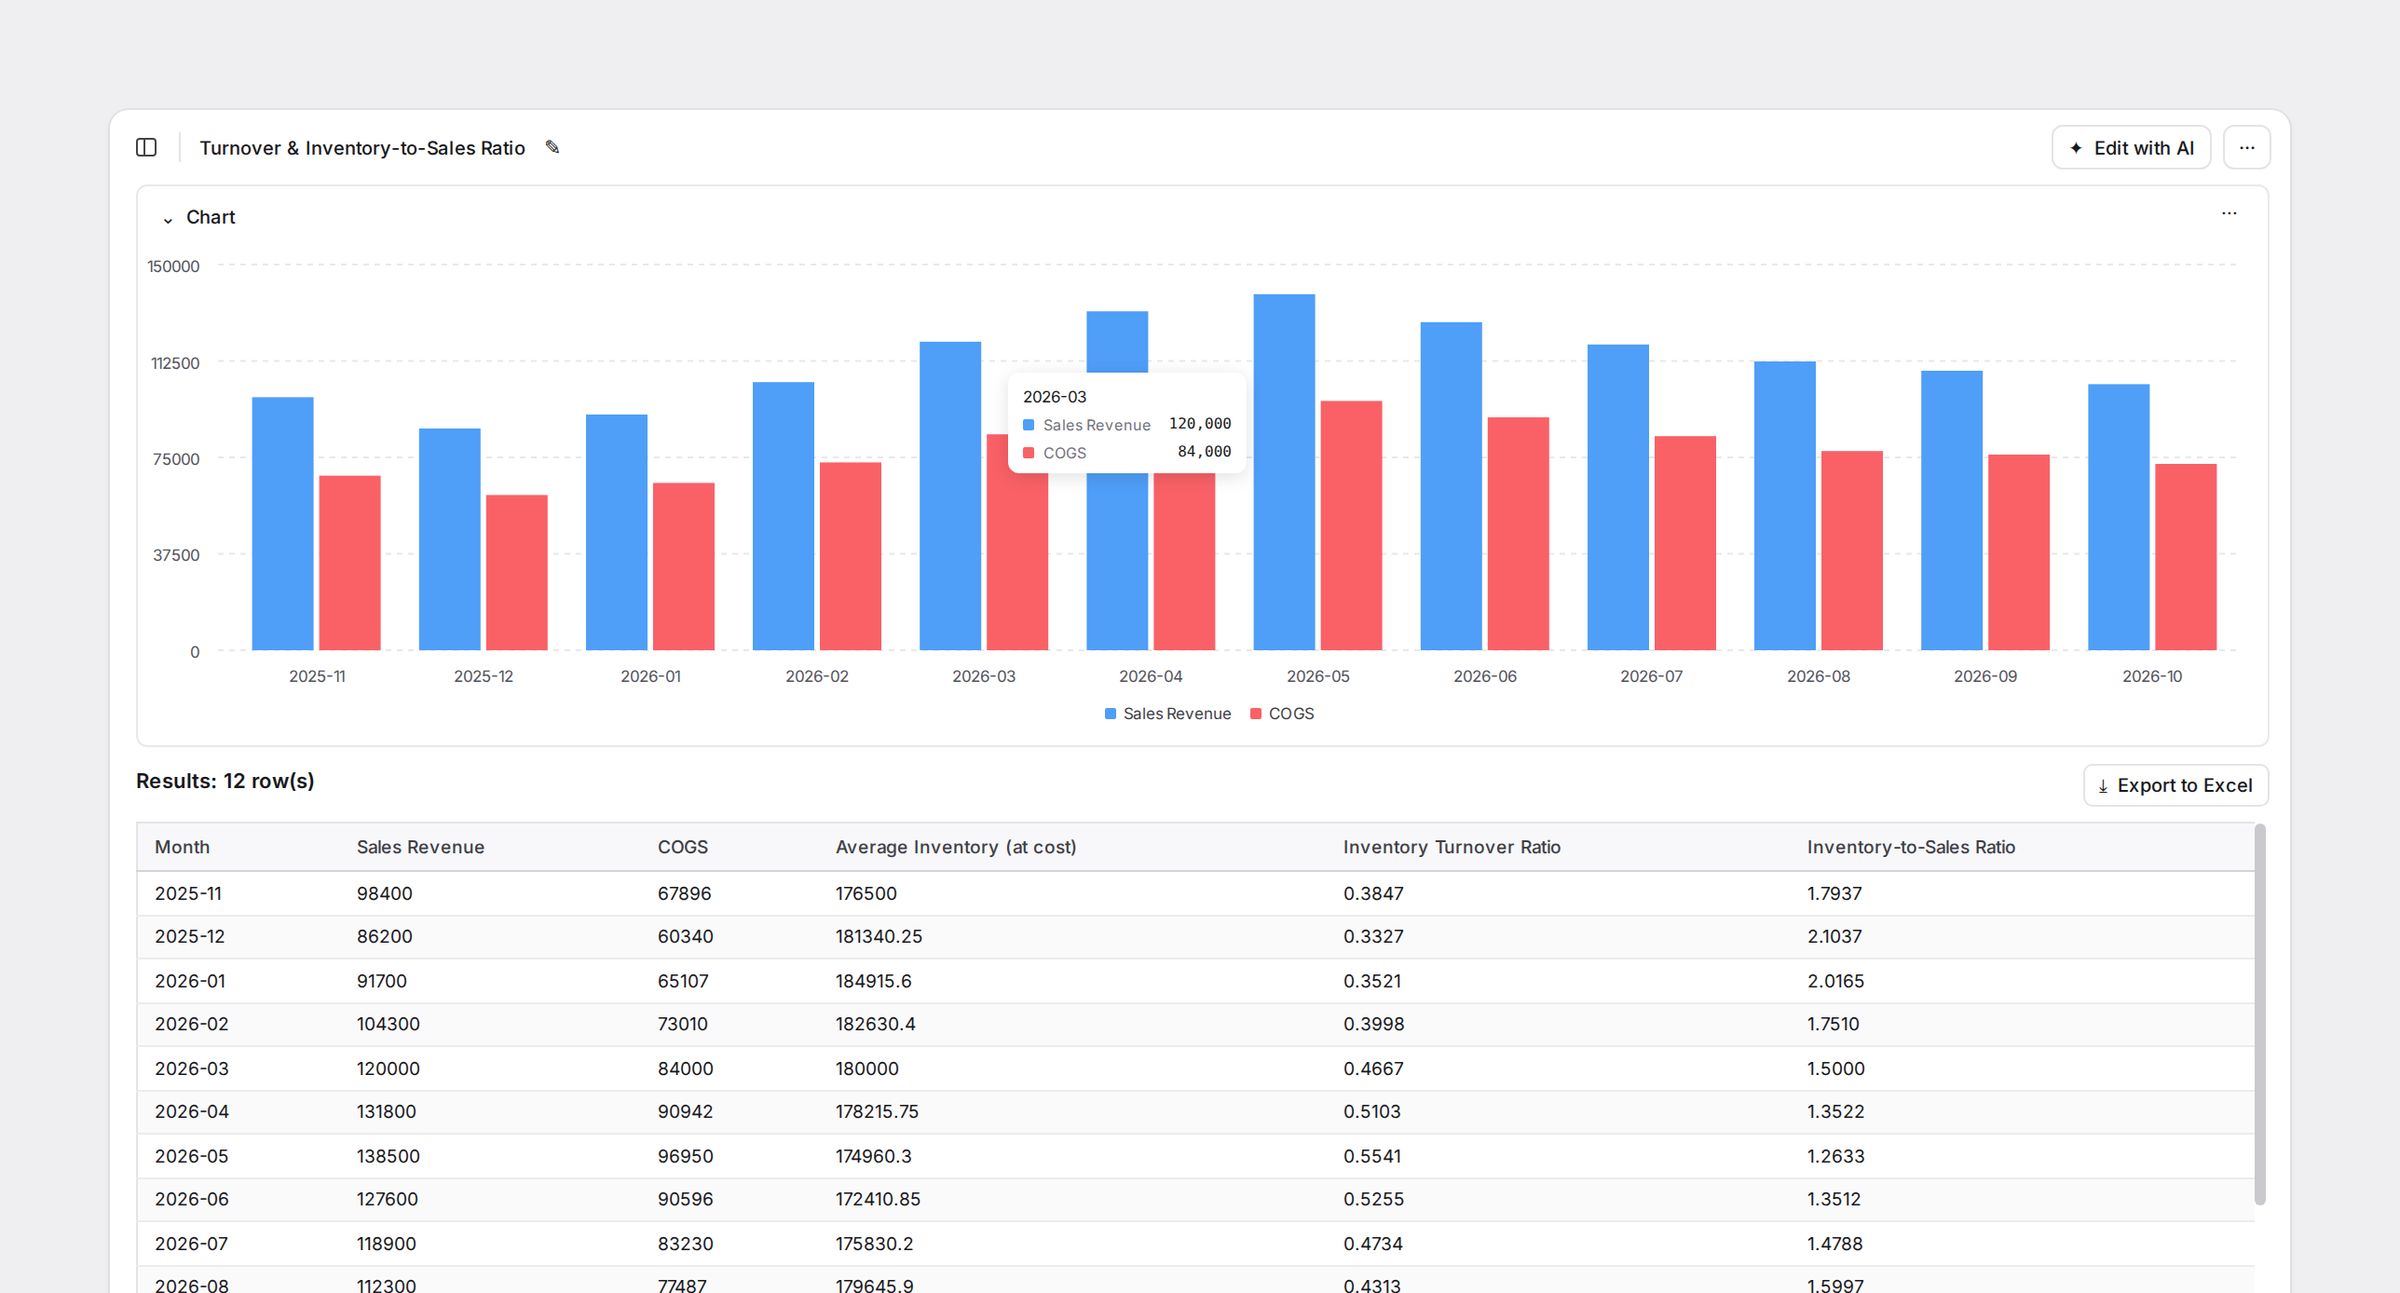
Turnover is normally calculated with cost of goods sold (COGS), while the inventory-to-sales ratio uses sales revenue (which includes your markup). That's why turnover based on cost usually comes out lower than 12 divided by your ratio.
Back to the hardware distributor: if its gross margin is 30%, the cost of goods sold in March was $84,000 (70% of $120,000). Measured at cost, the same $180,000 of inventory covers about 2.1 months (roughly 65 days), which works out to annual turnover of about 5.6.
Compare Your Number With Benchmarks
There is no single good inventory-to-sales ratio. Comparing yourself to the national average won't tell you much, so find the sector below that's closest to your business and use that number.
🇺🇸 United States, by Sector
The Census Bureau's Manufacturing and Trade Inventories and Sales report breaks the national ratio into three sectors. Figures below are seasonally adjusted.
| Sector | July 2026 | July 2025 |
|---|---|---|
| Merchant wholesalers | 1.20 | 1.28 |
| Retailers | 1.27 | 1.28 |
| All businesses | 1.30 | 1.37 |
| Manufacturers | 1.47 | 1.56 |
All three sectors ended July 2026 with lower ratios than a year earlier. Total sales grew 8.9% over that period. Inventories grew 3.8%.
🇨🇦 Canada
Statistics Canada publishes monthly, seasonally adjusted ratios for manufacturing and wholesale trade. In July 2026, Canadian manufacturers had a ratio of 1.62, and wholesalers (excluding petroleum products, oilseed, and grain) had a ratio of 1.51.
Both run higher than the U.S. figures for the same month, though the two countries define their sectors a little differently.
🇯🇵 Japan
Japan's Ministry of Economy, Trade and Industry (METI) reports an inventory ratio for mining and manufacturing as an index, with the 2020 average set to 100. The seasonally adjusted index for July 2026 was 104.5, meaning manufacturers were holding about 4.5% more inventory relative to shipments than they did on average in 2020.
Because it's an index, you can't compare it directly with a ratio like 1.47. It's still useful for seeing whether Japanese manufacturers are building up stock or cutting back.
🌍 Other Countries
Many national statistics offices publish inventory and sales figures as separate series. If yours does, divide the inventory figure by the sales figure for the same sector and month. Check that both figures use the same seasonal adjustment and currency basis before you compare.
Benchmark Your Own Ratio
National figures combine thousands of businesses of different sizes. Use the benchmarks to see where you stand and which direction the market is moving.
- Calculate your ratio for each of the last 12 months. Use month-end inventory at cost and net sales for the same month.
- Choose the closest published sector. A distributor should compare against merchant wholesalers, an online apparel shop against clothing stores, and a small food producer against manufacturers.
- Match the seasonal basis. Published benchmarks are usually seasonally adjusted (smoothed to remove busy and slow periods), but your own numbers aren't. Compare against the Census report's unadjusted figures instead, or against your own ratio from the same month last year.
- Track the direction over six to twelve months. A ratio that has climbed for several months in a row tells you more than any single reading.
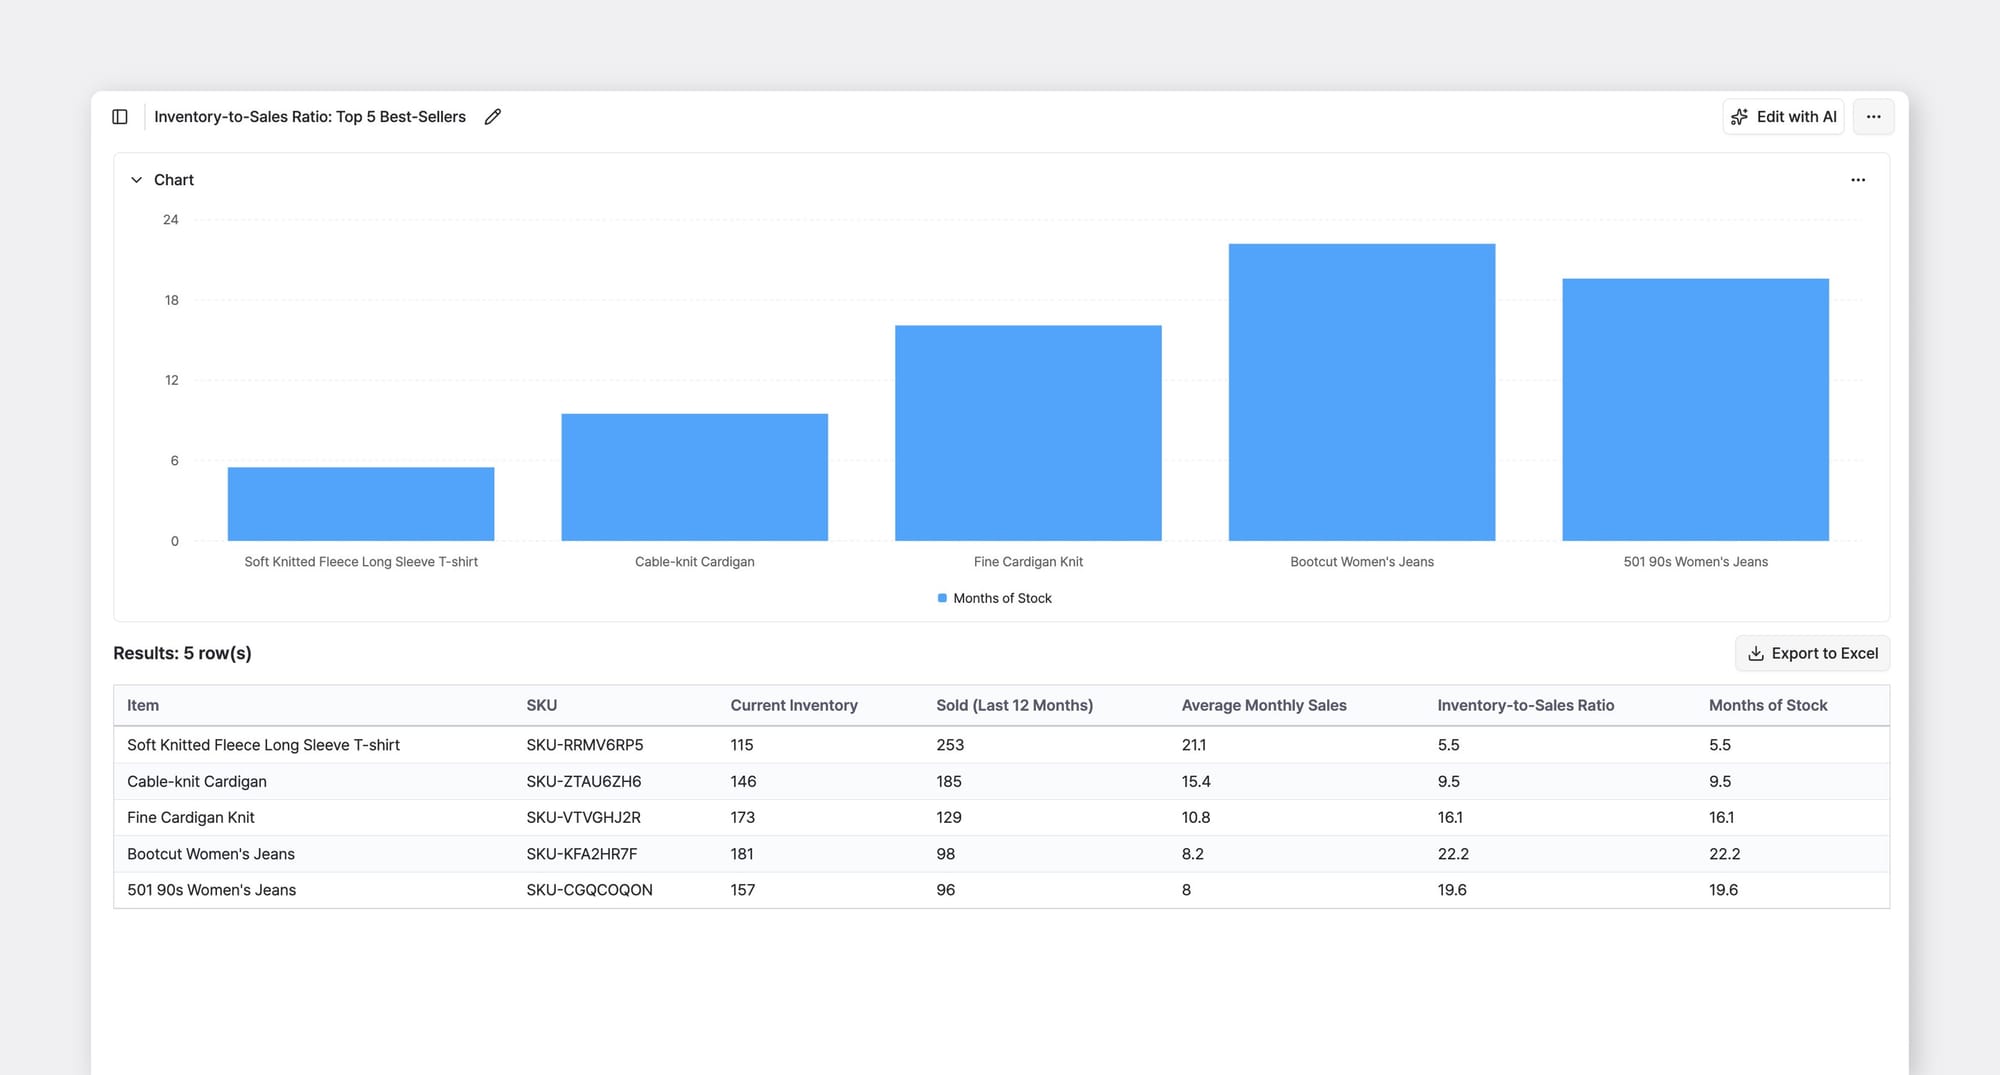
- Break the ratio down by product category. Calculate it separately for your main categories or top-selling items. A reasonable overall figure can include a few products with far more stock than their sales justify.
Act on Your Inventory-to-Sales Ratio
If Your Ratio Is Above Your Sector Benchmark
- Find items with no recent sales. Pull a list of products with no outgoing movement in the last 60 to 90 days and start your review of excess stock.
- Order smaller quantities more often. Lower the reorder quantity on slow-moving items, even if the unit cost rises slightly.
- Clear aging stock. Discount it, bundle it with faster sellers, or return it to the supplier where your terms allow.
- Review safety stock settings. Buffers set during past supply disruptions may be higher than current lead times require.
If Your Ratio Is Below Your Sector Benchmark
- Check your stockout history. Count how many times top-selling items reached zero in the last quarter, along with any backorders or lost orders.
- Recalculate reorder points. Use current supplier lead times and recent sales rates.
- Raise safety stock for top sellers only. Adding stock across the full range would raise the ratio without improving availability on the items that sell most.
- Look at what moved the ratio. A falling ratio can come from rising sales or from shrinking inventory. The first is a sign of growth, but the second can lead to stockouts.
Make It a Monthly Report
Calculate the ratio on the first business day of each month and record it next to the latest published figure for your sector, noting which month that figure covers. The Census Bureau, Statistics Canada, and METI all publish on a fixed monthly schedule.

Start Tracking Your Ratio Today
A single month's ratio won't tell you much on its own. Tracked every month next to your sector's benchmark, it shows early whether stock is building up faster than you can sell it — and that gives you time to adjust orders before the extra inventory turns into a cash problem.
BoxHero records every Stock In and Stock Out activity by item and location, so you can pull month-end inventory value and outgoing quantities from that history without a manual count. Try it yourself with a free 30-day trial.