How to Create Custom Inventory Reports with the AI Assistant
Most inventory reports fall into one of two categories.
The first includes reports you already have. Inventory value, turnover, and average quantity on hand are common examples — standard metrics that are built into most inventory systems.
The second includes reports that answer specific business questions.
- How many units did we ship to ABC Co. this year, by month?
- Which supplier delivered the most inventory last quarter?
These questions often require extra work. Someone exports the data, builds a pivot table, writes formulas, and repeats the process every month or quarter.
Custom Analytics takes a different approach. Instead of building reports by hand, you describe what you need in plain English, including the filters, date ranges, fields, and groupings. BoxHero's AI Assistant generates the report for you automatically, so there's no need to build formulas yourself.
What is Custom Analytics?
Custom Analytics is BoxHero's AI-powered reporting tool, available on the Business Plan at no extra cost.
Inventory Reportscover common metrics with predefined formulas. They work well for everyday inventory tracking, but can’t answer every question a team may have.Custom Analyticsfills that gap. The built-in AI Assistant turns your request into a report from your team's inventory data, going beyond standard metrics.
The result is a ready-to-use table that you can export to Excel, view as a chart, or save for your team to run again later.
How to Build a Custom Inventory Report
1. Describe what you need
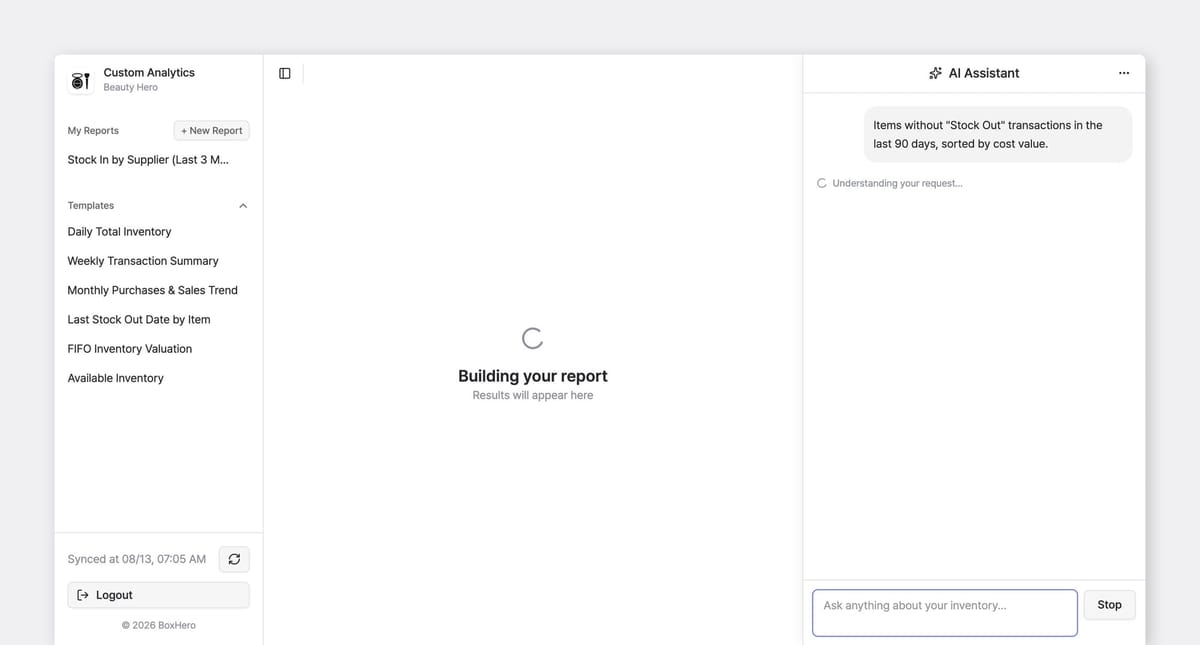
Tell the AI Assistant what you want to see and include any conditions it has to meet. The more specific the question, the better the result. For example:
• Find items without Stock Out transactions in the last 3 months.
• List the top 10 items by quantity shipped last month.
You can include details such as item name, attribute, price, date range, partner, or location. The assistant uses the information you provide to build the report.
2. Review and refine
The generated table appears below your request. If the result isn’t quite what you need, you can adjust your question and run it again.
You can also continue the conversation with follow-up requests. Add a field, narrow the results, or group the data differently. The AI Assistant remembers the context of your previous request, so you can refine the report without starting over.
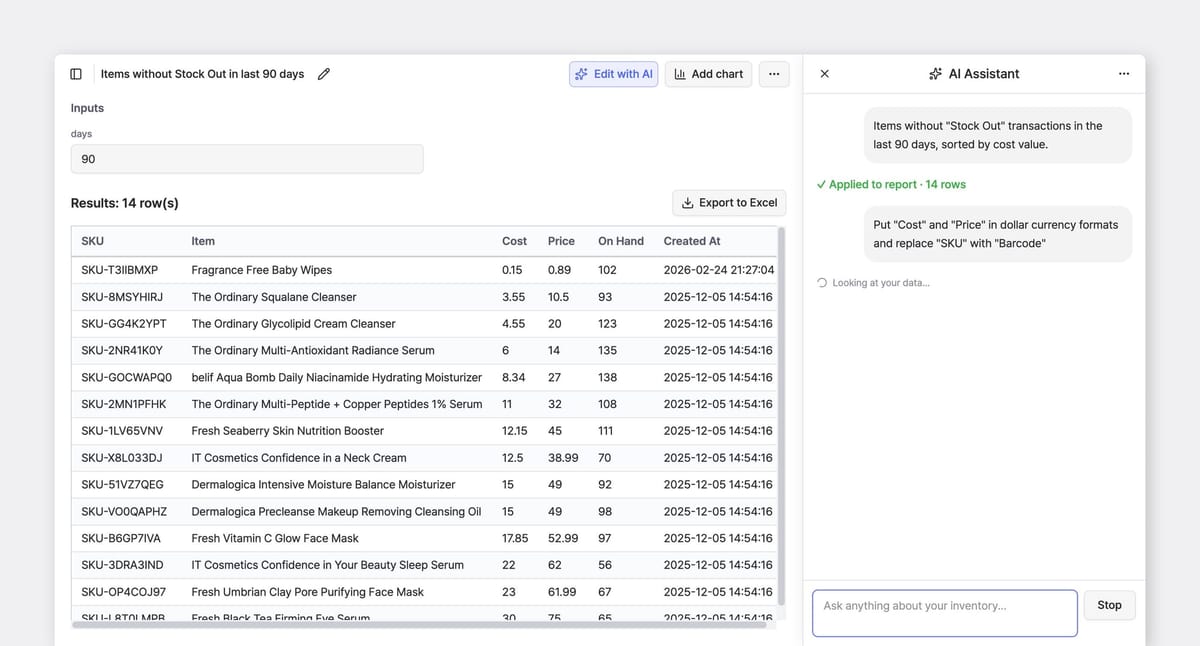
You can edit the generated query directly using DuckDB SQL.
3. Save, visualize, or export
Once your report is ready, you can save it to your sidebar for quick access later. You can also switch to a chart view when visualizing trends is more useful than looking at a table, or export the results to Excel for sharing and further analysis.
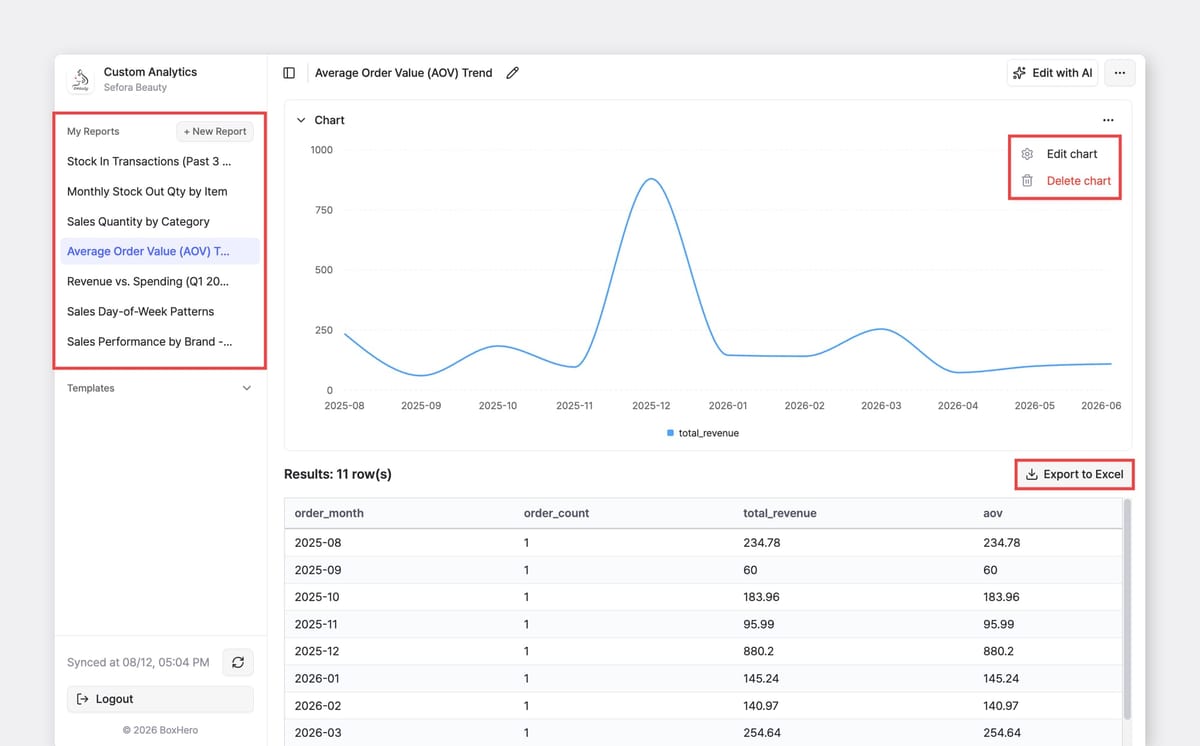
{{date}} and {{partner}} that anyone on your team can fill in when they run the report.4 Ways to Ask Custom Analytics for a Report
Most inventory questions fall into one of four categories: filter, rank, compare, and group. Many real-world reports combine two or more of these approaches.
1. Filter and List
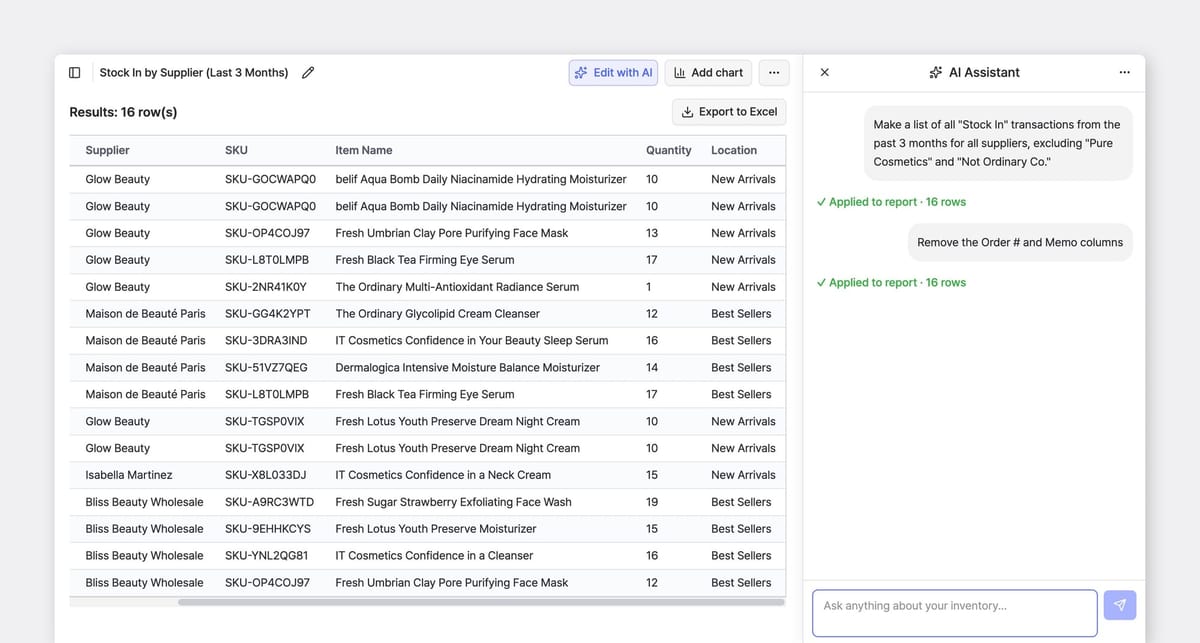
Ask for a specific set of items or transactions based on conditions you define. Good for reviewing exceptions, checking inventory levels, or pulling specific records.
• Show all Stock In from the past 3 months, excluding A and B suppliers.
• Find items below their safety stock level at the XYZ warehouse.
2. Rank
Find the top or bottom items based on a metric you choose. Changing the ranking criteria can completely change the results — ranking by quantity may highlight different items than ranking by cost value.
• Top 5 SKUs by quantity stocked out last month.
• Items without Stock Out in the last 90 days, sorted by cost value.
3. Compare Two Periods
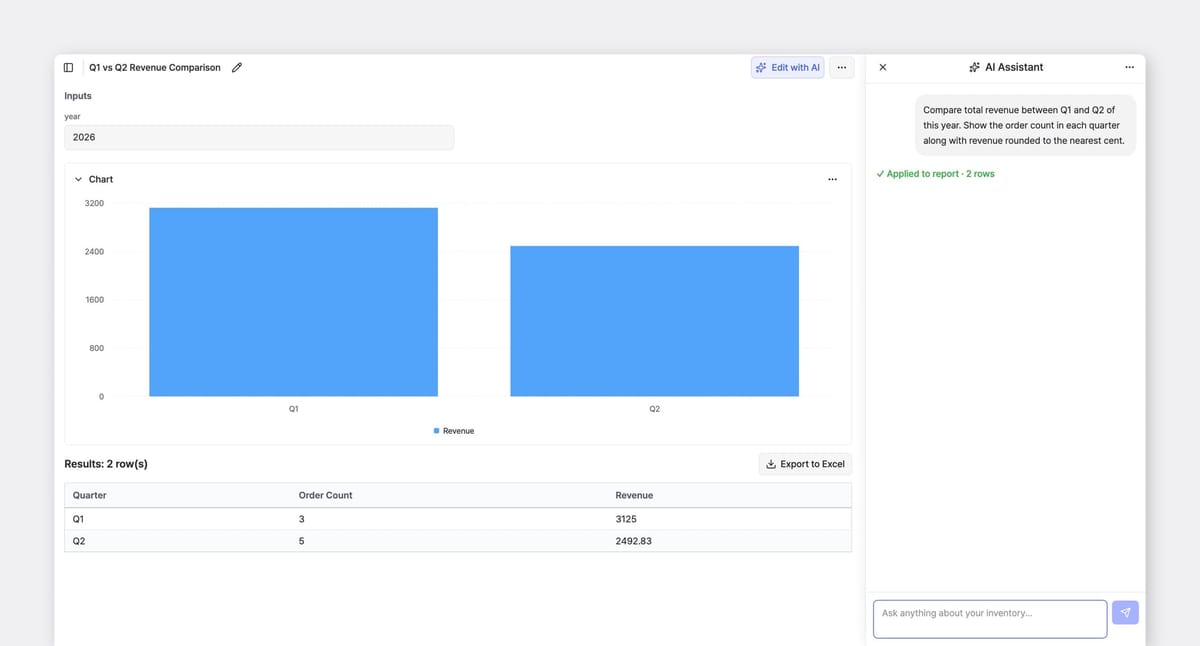
Compare inventory activity across two different time periods to identify changes, trends, or differences.
• Compare units sold by item between Q1 and Q2.
• Stock In vs. Stock Out quantity by item, last 90 days.
4. Group and Total
Summarize data by a specific field, such as location, supplier, category, or any custom attribute your team has created.
• On-hand quantity by location, valued at cost.
• Total revenue by customer, sorted from highest to lowest in dollar value.
Inventory Report Ideas by Industry
Every business tracks inventory differently, but the questions behind the reports are often similar: What do we have? What is moving? What needs attention?
Here are some example prompts by industry to help you get started.
🛍️ Retail and E-commerce
Retail teams often need to identify slow-moving inventory, track sales trends, and understand which products perform best across locations. When reviewing dead stock, sorting by cost value instead of unit count helps highlight the inventory with the biggest financial impact.
• Compare units sold by item, this month vs. same month last year
• Top 20 SKUs by units stocked out, grouped by location
👷♂️ Construction and Field Service
Construction and field service teams often move materials between warehouses, yards, vehicles, and job sites. Reports that track material usage by location can help with project tracking, billing, and identifying inventory adjustments.
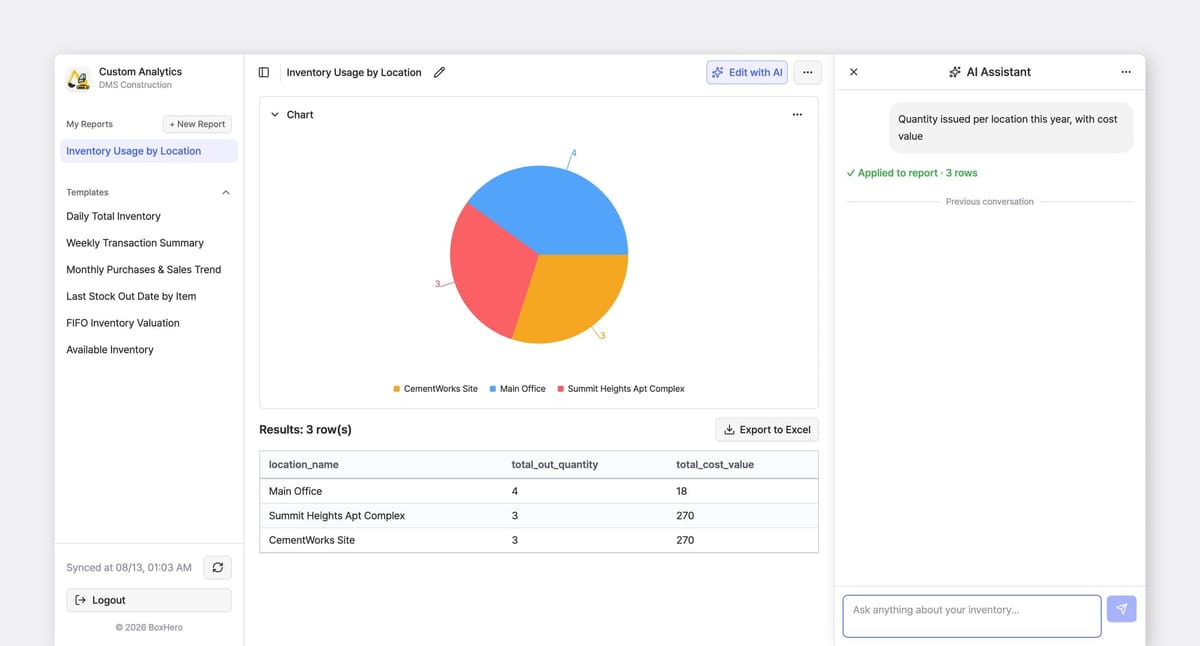
• Items adjusted down in the last 60 days, with the memo on each
• All Stock Out transactions by location for the last 30 days, grouped by item
🏥 Medical and Dental Clinics
For clinics, expiration dates are one of the most important inventory factors. By storing expiration dates as custom attributes, teams can filter and sort inventory to identify items that need attention before they become unusable.
• Items already past their expiration date, with current on-hand quantity
• Stock Out quantity by item over the last 6 months, grouped by month
🍔 Food and Beverage (F&B)
F&B businesses manage fast-moving inventory where expiration dates, receiving patterns, and supplier activity matter. Saved receiving reports can make it easier to review purchasing trends and upcoming expiration risks.
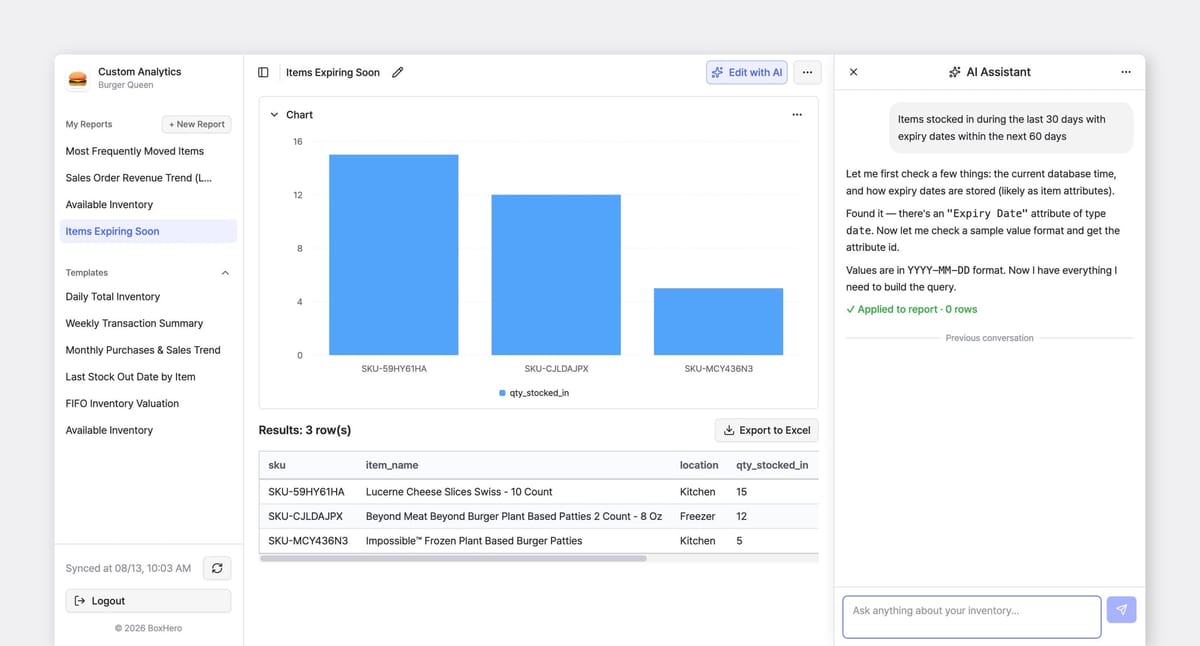
• Find items stocked in during the last 30 days with expiry dates within the next 60 days
🏭 Warehouse and Manufacturing
Warehouse and manufacturing teams need visibility into inventory movement, replenishment needs, and stock levels across locations. Comparing Stock In and Stock Out activity can help identify items that may need updated reorder points.
• Available stock by location, excluding items with zero on hand
💻 IT Asset Management
IT teams often need to know where assets are located, who is using them, and which items have become inactive. Reports on asset movement can provide a starting point for audits and equipment reviews.
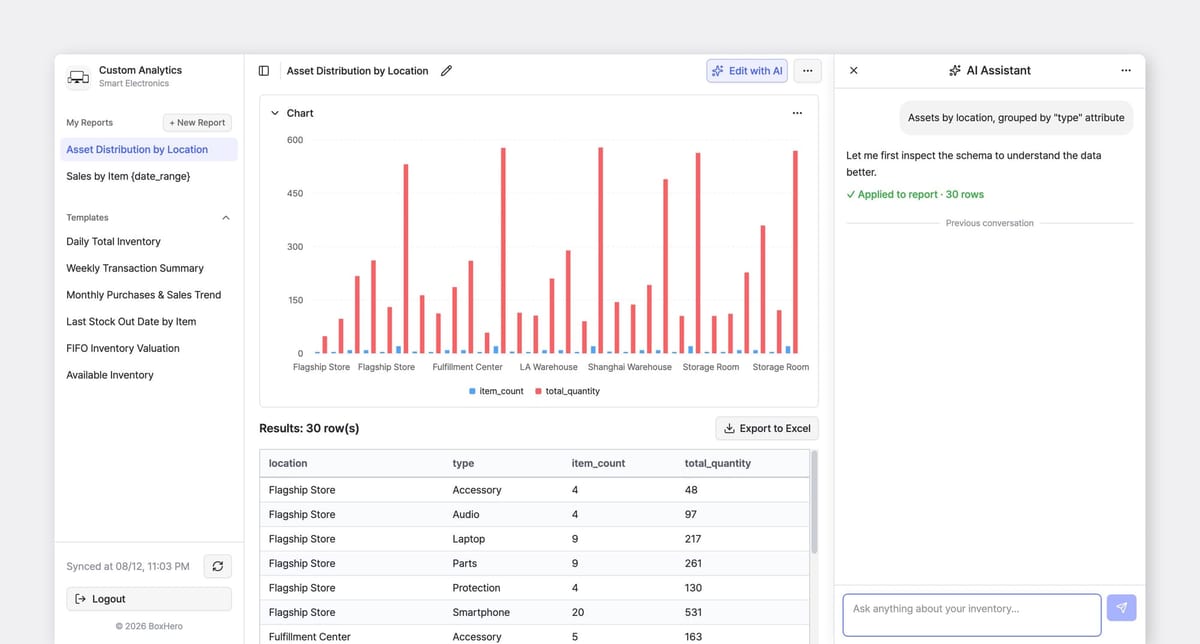
• Items with no transactions in the last 180 days, grouped by assignee
Choosing the Right Chart for Your Report
A table helps you find specific numbers, while a chart helps you see patterns. The best chart depends on the question you’re trying to answer.
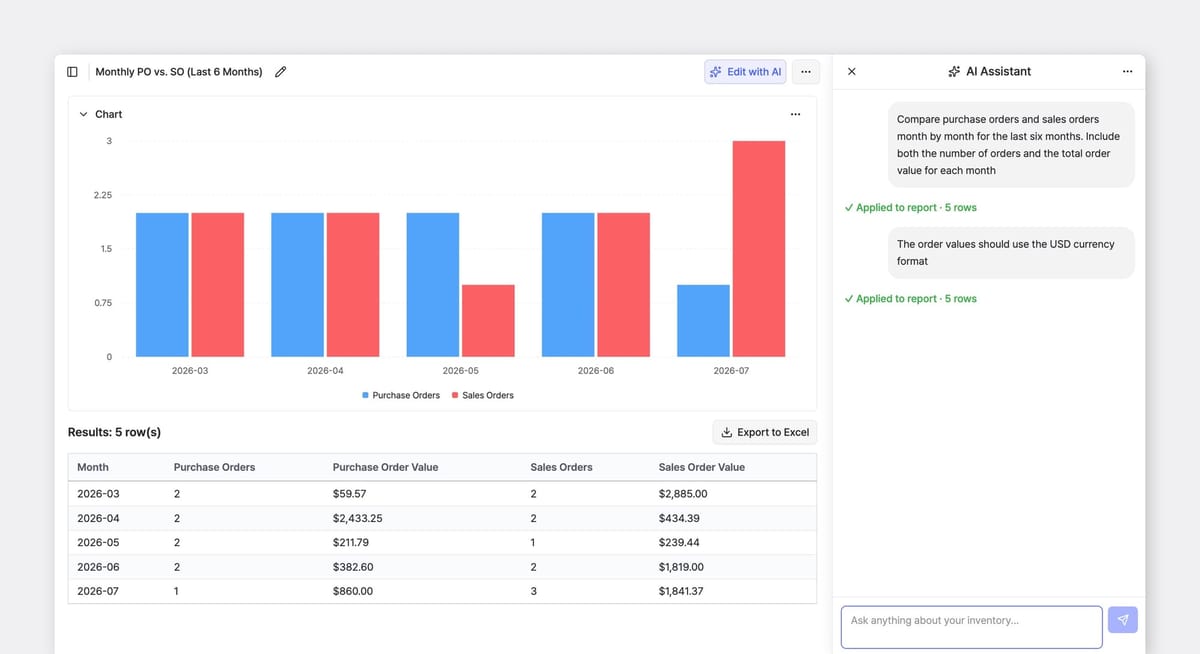
A few simple guidelines can help you choose the right view:
- Use a line chart to show trends over time. Too few periods can make normal fluctuations look like a trend, so 6–12 periods provide a clearer picture.
- Use a ranked bar chart to compare items or categories. Too many bars can make the chart difficult to read, so focus on the most important results.
- If the chart doesn’t answer your question, the issue is often the report request itself. Adjust the prompt to change the data being shown.
Start with Report Templates
Custom Analytics includes ready-to-use templates that you can run, modify, and save as your own reports. These templates are useful not only as finished reports, but also as examples of how to structure your requests and conditions.
BoxHero Templates:
- Daily stock levels
- Weekly transaction summary
- Monthly purchase and sales trend
- Last stock out dates
- FIFO inventory valuation
- Available inventory
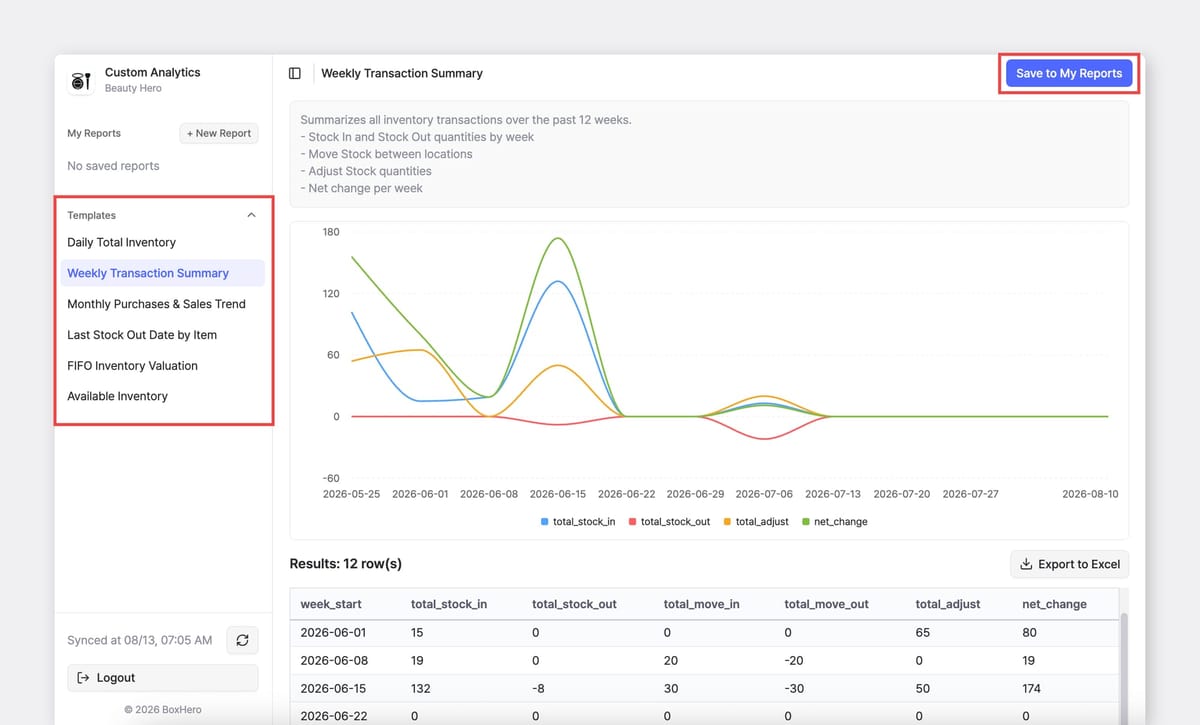
Open the template closest to what you need, adjust the filters or conditions, and save it with a new name. Over time, your team can build a library of reports that match your own inventory workflows.
Review Your Reports
One last thing: Custom Analytics helps you build reports quickly, but it’s always a good idea to review the results before exporting or sharing them with your team.
Check a few key details:
- Confirm the date range is correct.
- Verify that the right filters were applied.
- Check whether deleted items should be included.
- Make sure grouped totals match the level of detail you need.
If something looks off, simply ask the AI Assistant to adjust the report. There’s no need to start over or rebuild it from scratch.