How to Use Excel Spreadsheets for Inventory Tracking

If you run a small shop, warehouse, or side business, chances are your inventory started in Excel. Spreadsheets are familiar, inexpensive, and flexible enough to track stock without learning a new system.
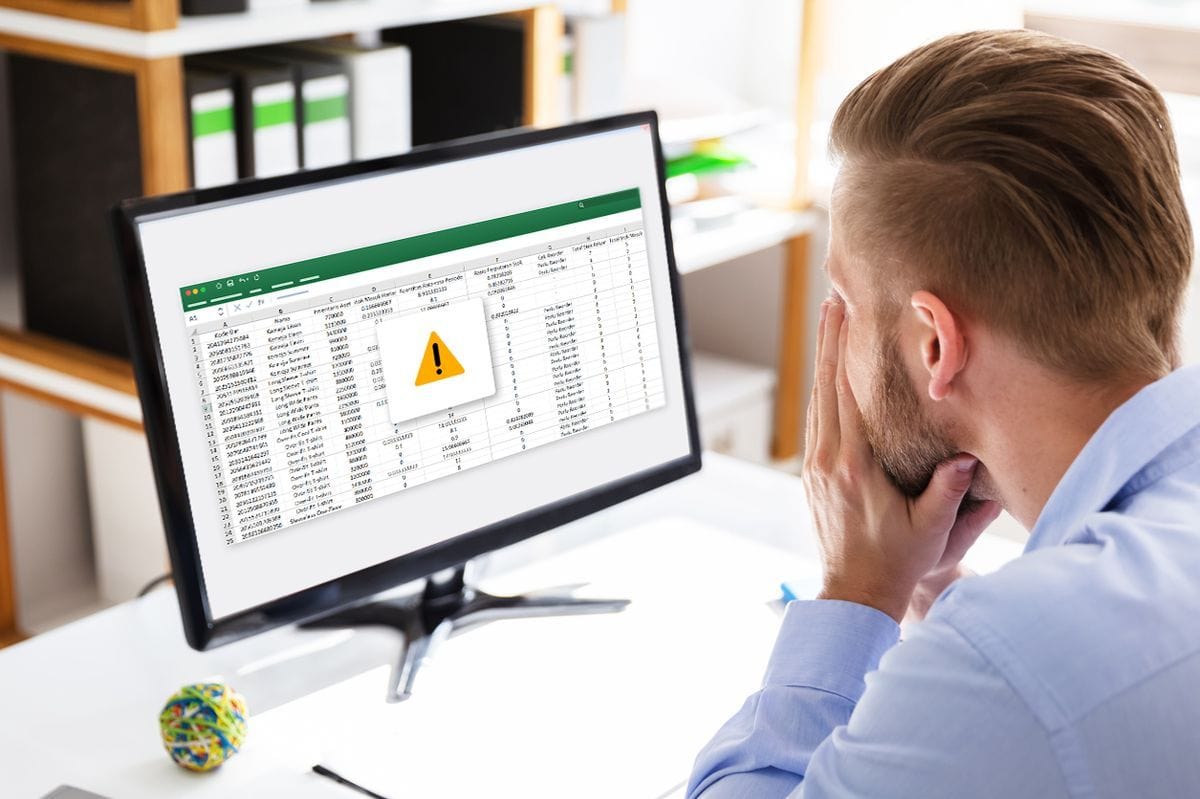
But spreadsheets can also get messy fast. One wrong formula or a missed update can ripple through your counts.
This guide shows you how to set up Excel for inventory (with formulas you can actually use), covers the limits of spreadsheets, and points out the signs it might be time to move to dedicated software.
By the end, you’ll have a clear understanding of how far Excel can take you, and when to consider the next step!
Why start with Excel in the first place?
Microsoft Excel has been around for nearly 40 years, and despite the rise of dedicated apps, it remains one of the most common tools for inventory tracking.
Why small businesses choose Excel:
- It's familiar: Almost everyone knows how to use it at a basic level.
- It's cheap: It’s often already installed, with no extra subscription fees.
- It's flexible: You can design your spreadsheets to match your business needs.
- It's transparent: Every calculation and list is visible. Anyone who opens the Excel file can follow the logic in the database.
The tech news site Wired noted that billions of people worldwide still rely spreadsheets—not only for calculations, but also for everyday organizational tools: making lists, managing projects, tracking tasks, and more.
For small startups and early-stage businesses working with limited resources, Excel often becomes the natural starting point. It’s already on most computers, it doesn’t add extra cost, and it’s flexible enough to shape around whatever process you need to get off the ground.
What Excel can (and can’t) handle
Spreadsheets are a solid foundation for getting organized, but they’re not designed to cover every situation. Here’s a realistic view of their strengths and their limits.
Strengths
- Handles small item catalogs well. A few hundred SKUs can be tracked reliably in Excel without issues.
- Simple for single-location businesses. If you have one shop or warehouse, it’s pretty straightforward to set up.
- Flexible reporting. PivotTables let you quickly analyze sales, stock levels, or supplier activity.
- Customizable. With Excel formulas, you can bend the sheet to fit your workflow; you're not limited by pre-set fields. Create a new formula to calculate reorder points, or add an extra column to track expiration dates or batch numbers!
Limitations
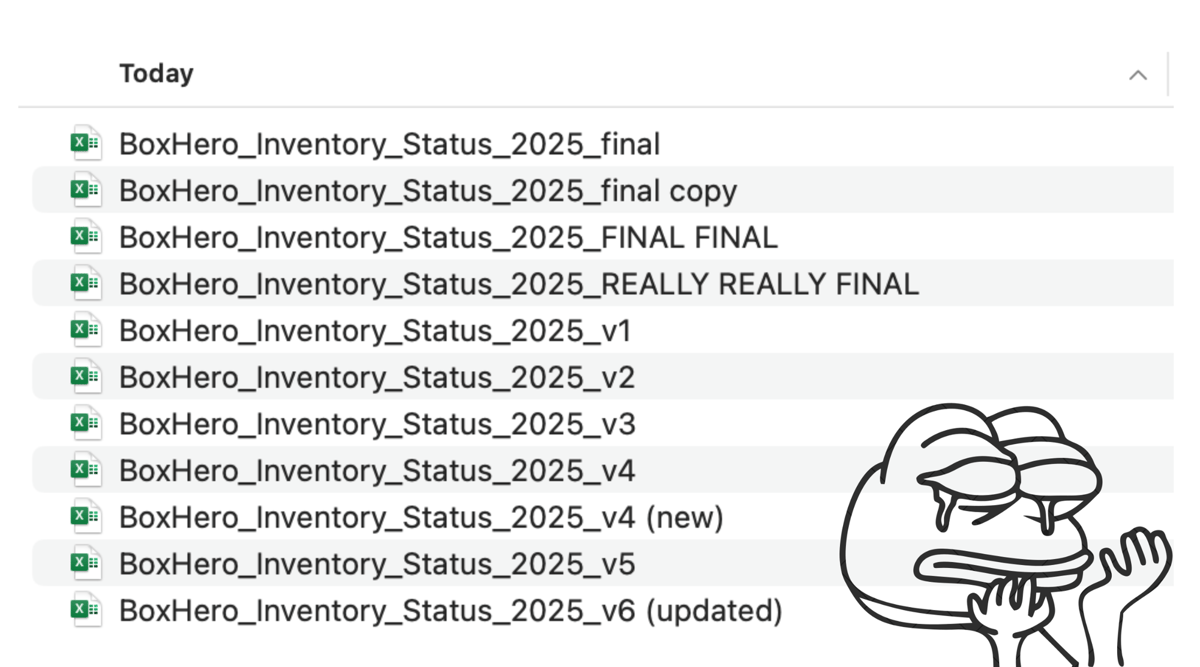
- Not built for simultaneous editing. While Excel supports co-authoring, version drift in shared folders still causes problems. If multiple people update counts, you’ll need clear rules for who edits what and when.
- Prone to errors. Spreadsheet mistakes are extremely common - and almost expected. 😬 Research shows that as many as 88% of accounting spreadsheets contain human errors, ranging from simple typos to logic flaws, with real-world consequences (and while that statistic comes from finance, the same risks apply to inventory tracking).
- Issues at scale. Excel handles a few hundred SKUs comfortably, but once you start logging thousands of transactions per day, it starts to slow down. Large workbooks become harder to calculate, easier to break, and more difficult to share. Version control also gets messy when several people need access at the same time.
- Limited controls. You can lock cells or hide sheets, but Excel doesn’t give you a true audit trail of who changed what and when.
- No built-in barcode scanning. It’s possible with third-party add-ins or workarounds, but Excel isn’t designed for mobile-first inventory management.
Spreadsheets work well as a starting point for learning the basics of inventory management. But as your team gets bigger, you’ll eventually run into their limits.
How to set up Excel for inventory management
Now that we’ve covered Excel’s strengths and limitations, let’s move on to building a simple inventory workbook. You only need a few well-structured sheets to create something reliable and easy to maintain.
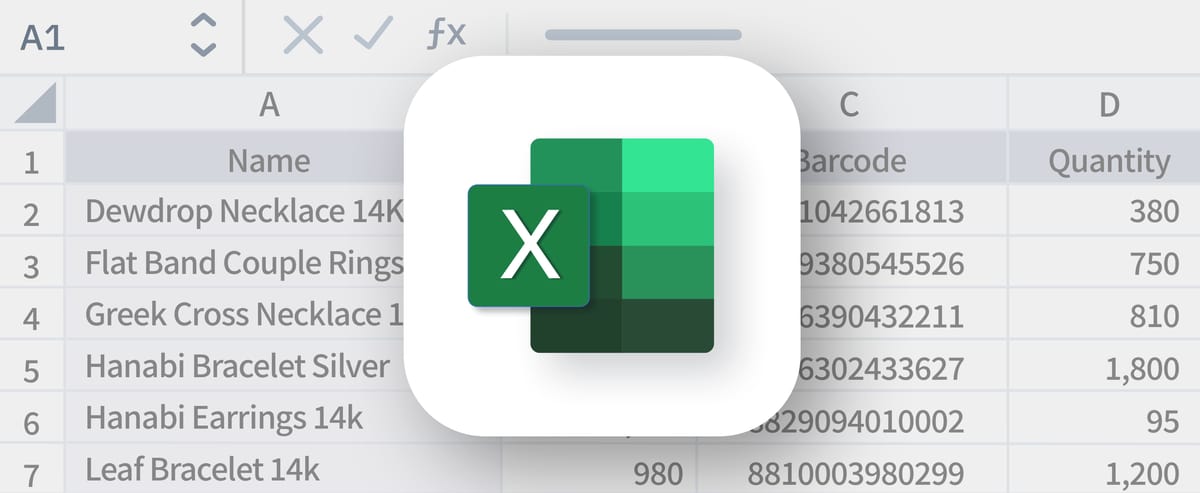
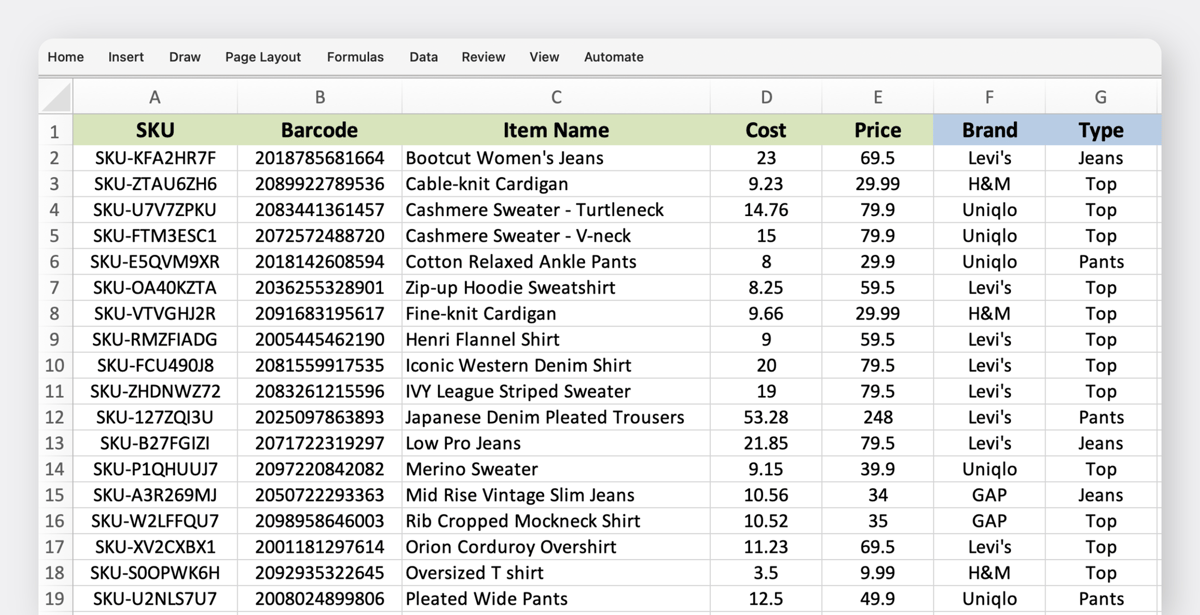
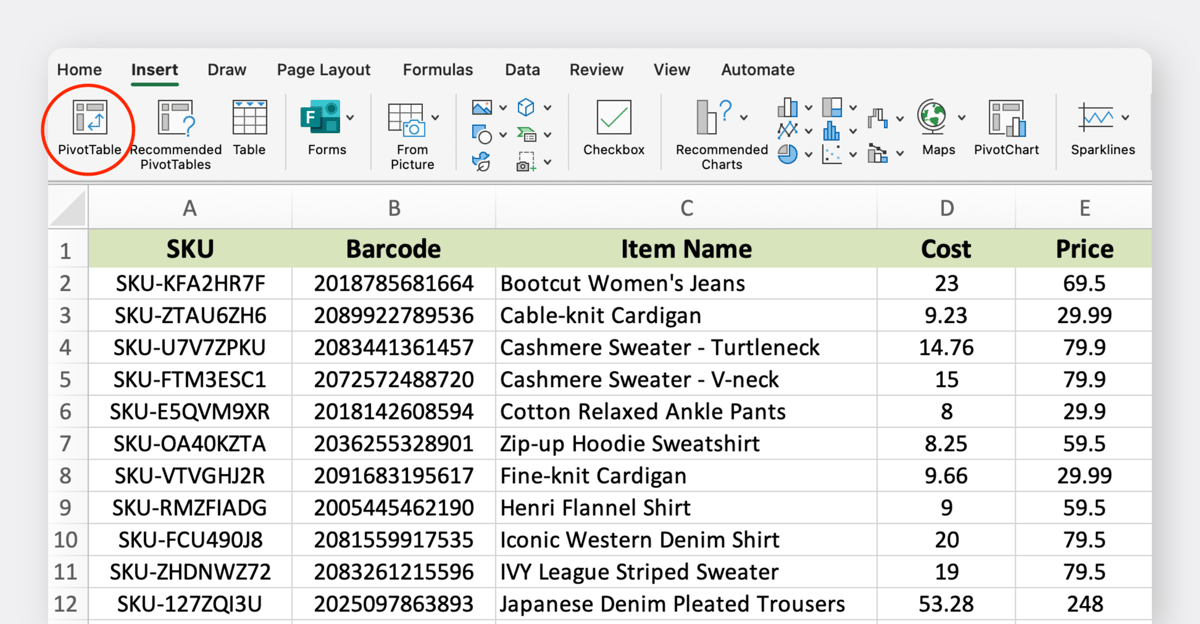
1. Create an Items Table
This is your reference list for everything you stock. Each row should represent a unique item or SKU, and the table holds all of the item's key details.
Include fields like:
- Item Name
- SKU
- Barcode
- Supplier
- Unit Cost
- Selling Price
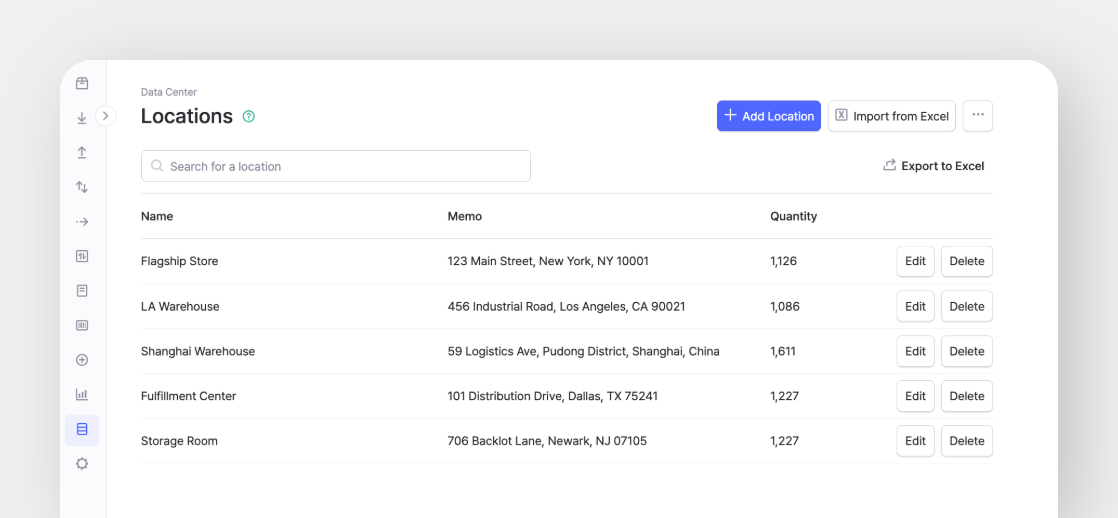
2. Create a Locations Table
Most businesses have more than one “location,” like a shop floor, a back room, an office cabinet, or an off-site storage unit. A simple Locations table helps you separate them.
- At a minimum, include Location Name and Notes/Address.
- This pays off later when you want to see stock by location — for example, knowing what’s on the shelf vs. what’s still in the storeroom.
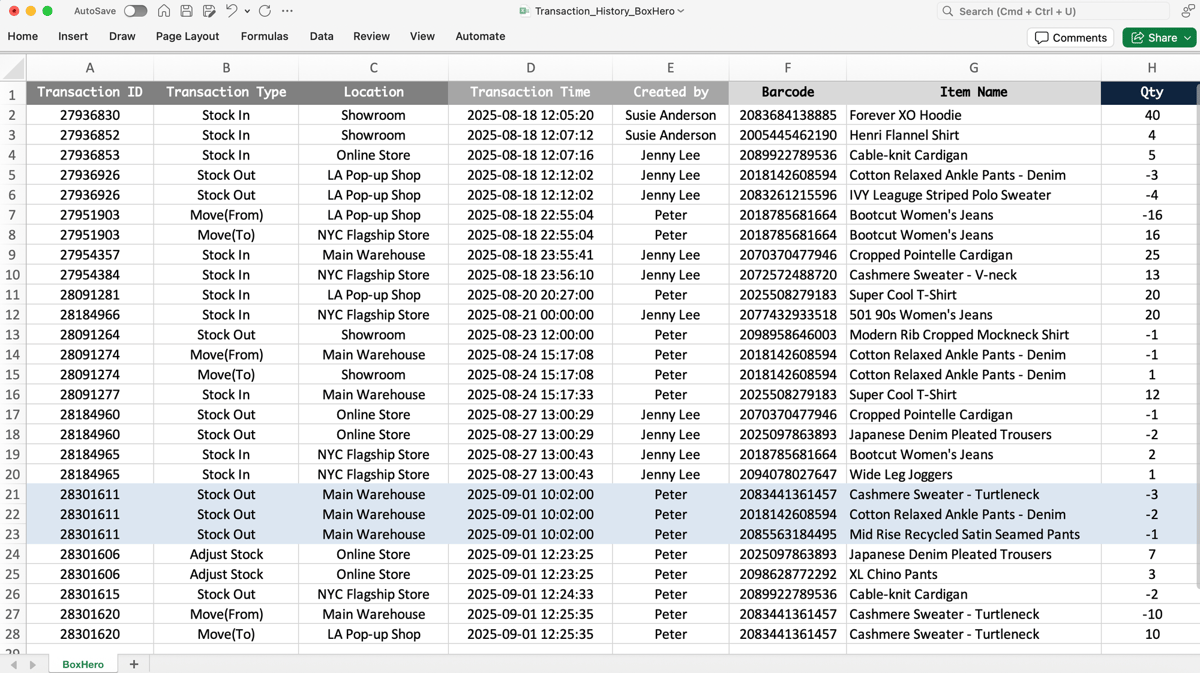
3. Set Up a Movements (Transactions) Log
This is where you record every stock change. It's like a running history of how items move in and out.
Use fields like:
- Date and Time
- Item (SKU)
- Qty In/Out
- Location
- Reference or Notes
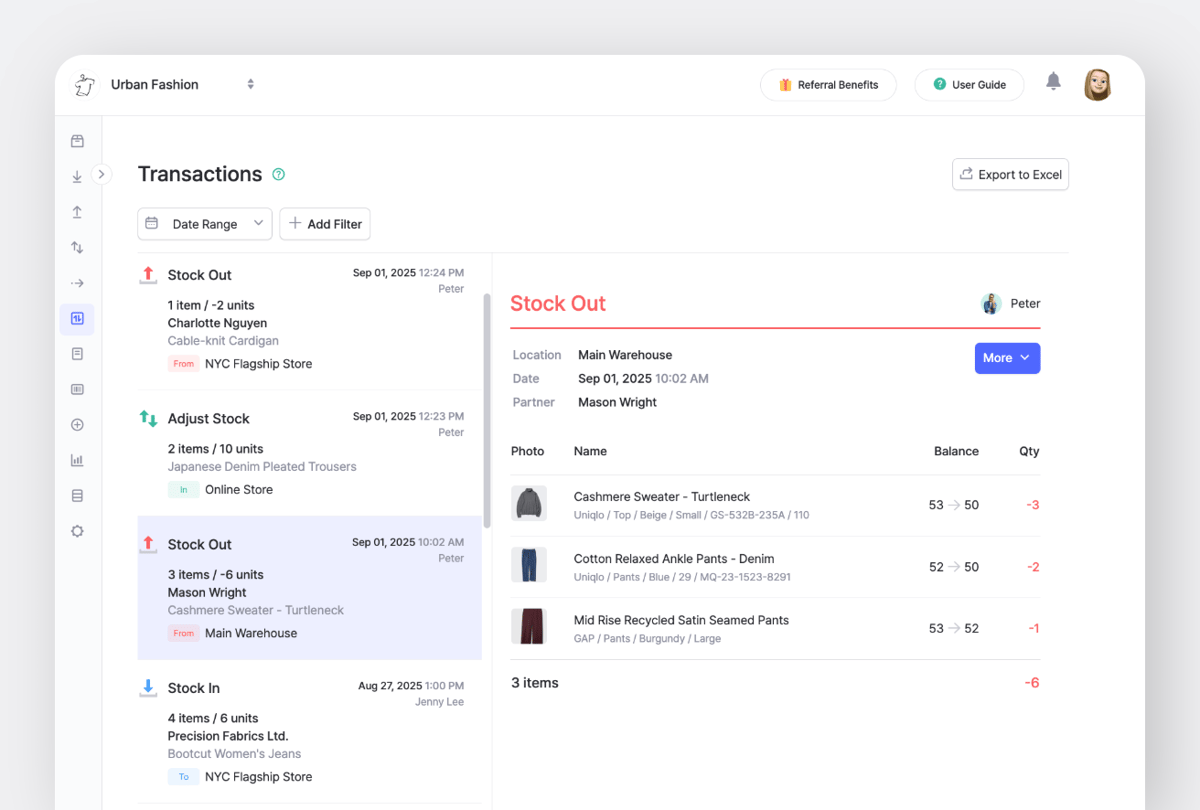
Each purchase, sale, return, or adjustment gets logged here. You can use the Reference or Memo column to record the reason for each movement or link back to purchase orders, sales invoices, or adjustment notes.
4. Build Stock on Hand Calculations
Once your items, locations, and movements are in place, you can calculate stock on hand automatically instead of typing balances manually.
- Create a separate sheet (or use a PivotTable) that pulls quantities from the Movements log.
- A basic formula looks like this:
= SUMIFS(Movements[Qty In], Movements[SKU], A2) - SUMIFS(Movements[Qty Out], Movements[SKU], A2)
Where A2 is the SKU you’re calculating for. This gives you the current on-hand stock for that item.
*** If you want more detail, set up a Stock by Location sheet that lists every item × location pair from your Movements table. From there, you can build:
- On Hand =
SUMIFS(Qty In) - SUMIFS(Qty Out)by SKU + Location - Committed (for open orders) = similar
SUMIFSagainst an Orders table - Available =
On Hand - Committed - Reorder Qty =
MAX(0, Reorder Point - Available)
If you need something slightly smarter, add:
- Average Daily Sales = total sales over the last N days ÷ N
- Days of Cover =
On Hand / Avg Daily Sales - Lead Time Demand =
Avg Daily Sales * Lead Time
5. Use PivotTables for Reporting
Excel can also generate reports quickly. PivotTables let you analyze inventory in different ways using the same underlying data.
A few examples:
- Stock by location = how much of each item is at each site
- Inventory value = total stock value calculated as (Qty × Unit Cost)
- Sales by item for the last 30 days
When Excel becomes a problem
Excel works well in the early stages, especially when:
- You have fewer than a few hundred SKUs.
- You handle a low volume of daily transactions.
- You’re working solo or with just one other person updating the file.
But issues arise when:
- Multiple people edit at once (version conflicts!!!).
- Managing multiple warehouses or shops becomes difficult.
- You need mobile scanning for faster counts.
- You want automatic alerts to prevent stockouts.
@corporate.snark #corporateworld #corporatelife #spreadsheet #excel workmen’s
♬ original sound - DeathRage187
At this point, dedicated inventory software adds the checks, audit trails, and mobile tools that spreadsheets simply don't offer.

Transitioning beyond Excel
The good news: your Excel data isn’t wasted. Most inventory apps, including BoxHero, let you import CSVs directly. Your items list and opening stock can form the starting point.
Steps for a smooth transition:
- Clean the data in your current workbook: one row per item, consistent location names, and barcodes (if available).
- Export CSVs for Items, Locations, and Movements.
- Import into your new system and do a small cycle count to confirm accuracy before a full switch.
What does BoxHero add to Excel spreadsheets?
BoxHero keeps the same familiar structure of items, locations, and movements, but adds the features Excel can’t cover on its own:
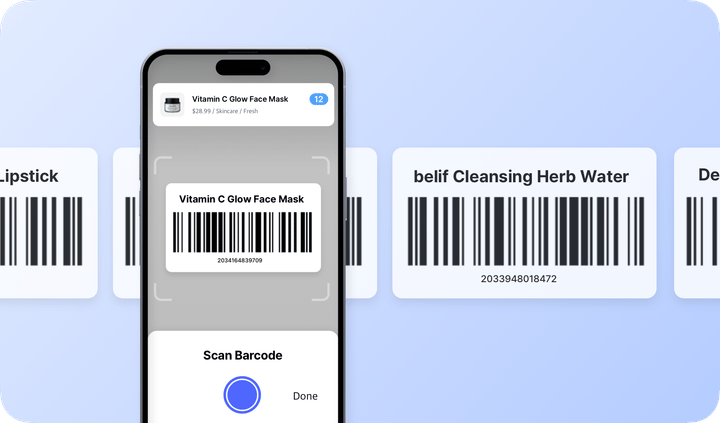
- Barcode scanning and label printing on mobile without extra hardware. Handy for counts and quick stock in/stock out!
- Multiple locations without duplicated sheets or complicated formulas.
- Excel import and export, so you can bring your existing data and keep using Excel for analysis.
- iOS and Android apps that update movements in real time:
- Get it on the App Store
- Download from Google Play


Final Thoughts
Excel can be a perfectly good starting point for inventory management, as long as you know its limits. With a clean items list, a movements log, and a few well-placed formulas, it can handle the basics fairly well.
Over time, though, spreadsheets reach their breaking point.
As transactions increase and you add more locations or team members, Excel becomes harder to maintain and easier to break.
That's when it makes sense to migrate to dedicated inventory software like BoxHero, which builds on the same foundations but adds features spreadsheets can’t: real-time collaboration, mobile scanning, low stock alerts, and more!
RELATED POSTS