Using Sales Reports to Guide Inventory Decisions
According to the U.S. Small Business Administration, many small businesses rely on sales records mainly for compliance rather than inventory planning. Even though thousands of item movements are recorded each month, those transactions are often reviewed only for tax reporting or month-end reconciliation.
BoxHero’s Sales Reports help turn transaction history into information that supports purchasing, pricing, and cash planning. They connect sales activity directly to inventory changes by pulling data from recorded sales and purchases, grouping it across selected time periods, and presenting it in views that reveal buying patterns and item movements.
In this article, we’ll walk through how BoxHero's sales reports work in a practical inventory context and how teams use them as part of regular purchasing and pricing decisions.
Understanding Sales Report Functionality
The Sales Reports feature pulls data from the Purchases & Sales menu. When you record a sale, BoxHero captures the item name, quantity, unit price, total amount, and timestamp. This information is then processed to calculate total sales volume and revenue with filtering options for specific items and date ranges.
BoxHero organizes this data through two distinct tabs:
- Profit Analysis
- Sales Summary
One focuses on item-level performance and profit. The other summarizes sales, purchases, and returns across a period. Let's take a closer look at each tab.

1) Profit Analysis Tab
The Profit Analysis tab focuses on individual item performance and profitability metrics. This view presents data at the item level, accounting for sales, returns, and refunds.
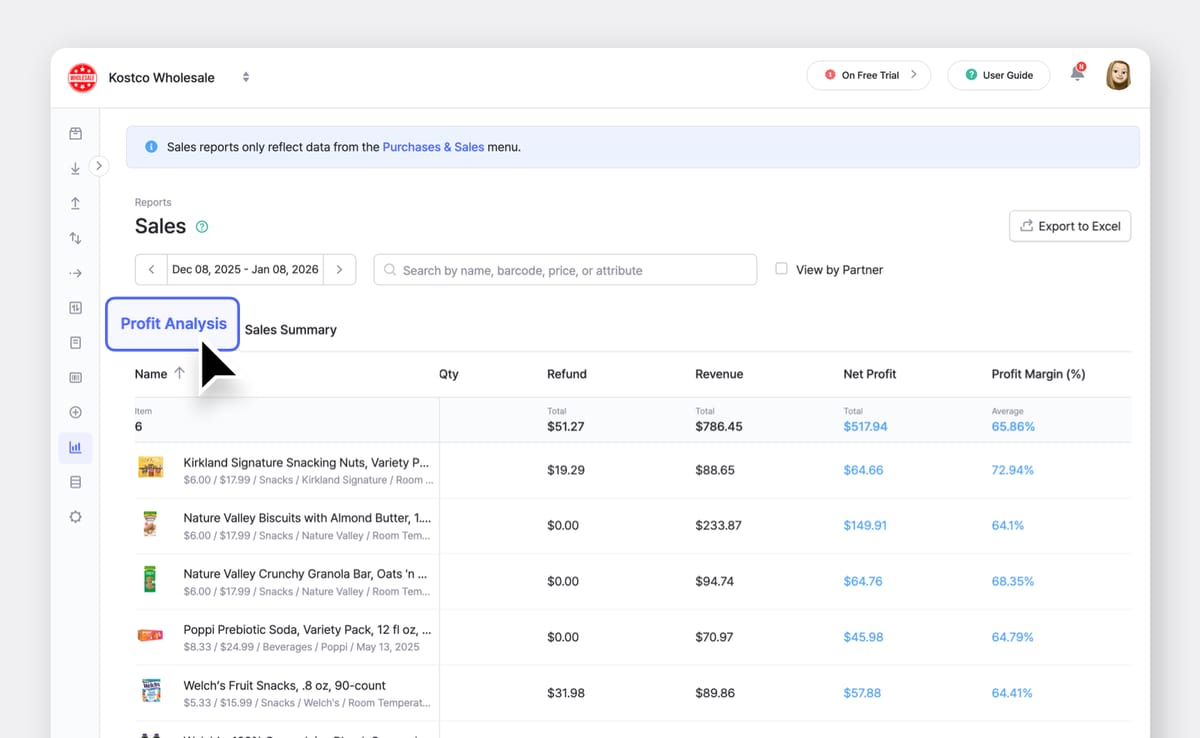
- Average Sale Price appears as the first metric. It shows the average unit price at which an item was sold during the selected period. This number helps identify pricing consistency and reveals whether discounting affects specific products more than others.
- Sales Quantity tracks the total number of units sold for each item. This raw volume metric helps determine reorder quantities and identifies fast-moving versus slow-moving stock.
- Sales Amount is the total value of all recorded sales for the item before returns and refunds are deducted. This number is calculated directly from recorded sales entries, not from estimated price lists.
- Return Quantity shows how many units were returned during the selected period. Returns reduce effective sales volume and affect profit calculations.
- Refund Amount reflects the total value refunded to customers for returned items. This figure is separate from sales amount so you can see the financial impact of returns clearly.
- Revenue represents sales amount minus refunds. This is the actual amount retained from sales after returns are processed. The net amount helps distinguish between gross sales activity and what was actually collected.
- Net Profit is calculated by subtracting the item’s fixed purchase cost from revenue. This cost is set at the item level and remains consistent across sales—making this view useful for comparing item performance over time.
- Profit Margin expresses net profit as a percentage of revenue, allowing items with different price points to be compared on the same scale.
• Net profit shows how much money an item earned in total.
• Profit margin shows how much you kept from each sale as a percentage (i.e. how efficiently the item uses your capital).
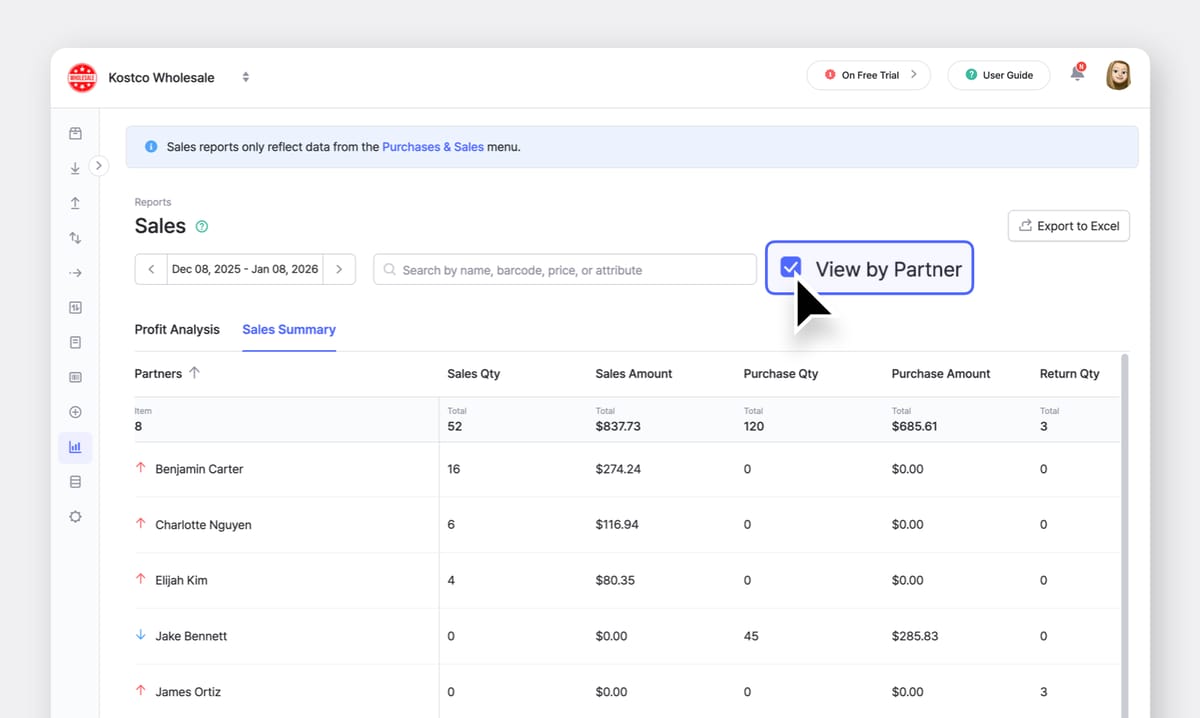
2) Sales Summary Tab
The Sales Summary tab focuses on transaction flow rather than item-level pricing performance. It combines sales, purchases, and returns into data that can be organized by customer or supplier ("Partners" in BoxHero), showing the complete transaction picture for each business relationship.
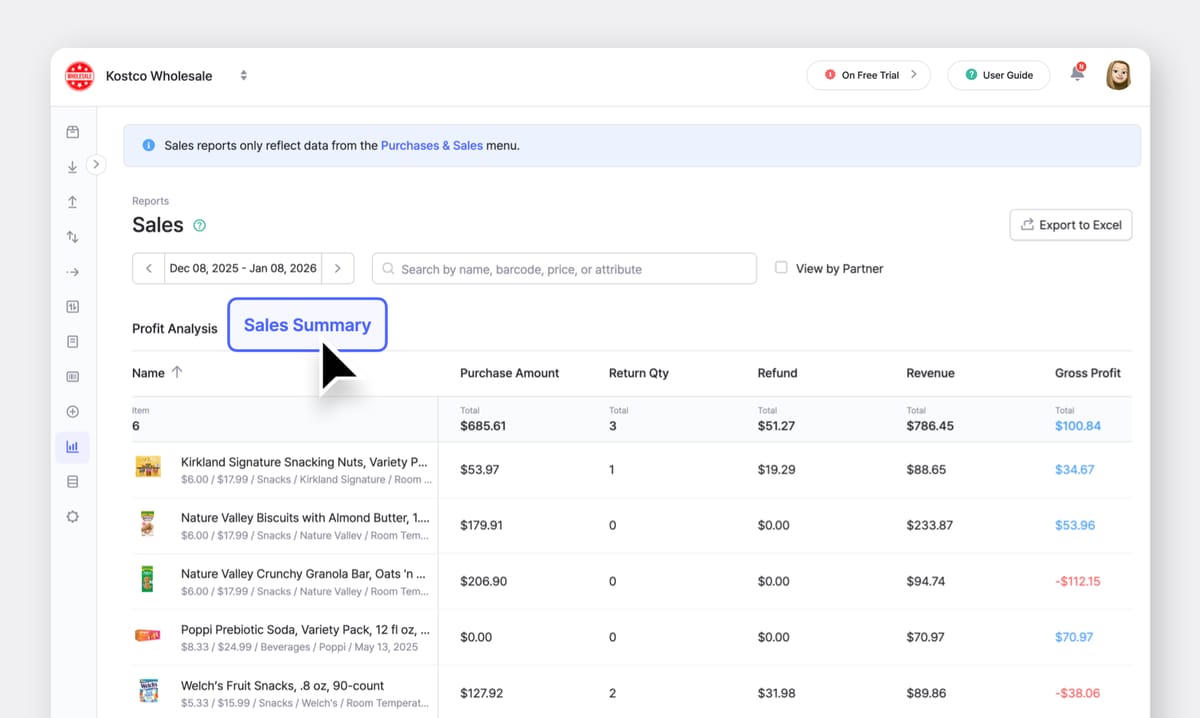
- Sales Quantity and Sales Amount appear here as they do in the Profit Analysis tab. You see the total number of units sold during the selected period and total value of recorded sales before refunds.
- Purchase Quantity shows how many units were purchased during the same period. This allows side-by-side comparison of inflow and outflow without switching reports.
- Purchase Amount reflects the total value of purchases recorded during the selected period. It uses the cost entered at the time of purchase, and makes it easier to compare how much inventory was brought in vs. how much was sold.
- Return Quantity and Refund Amount function identically to the Profit Analysis tab. Return quantity shows the number of units returned during the selected period. Refund amount shows the total value refunded.
- Revenue shows sales amount minus refunds, providing a clear picture of collected sales value for the period.
- Gross Profit differs from the "Net Profit" shown in the Profit Analysis tab. It is calculated using the actual purchase prices recorded in Purchase Orders (POs) within the selected date range. Because this view only includes purchases made during that period, gross profit here is best used for period-level review rather than item-level comparison.
Side Note:
The View by Partner checkbox at the top of the interface toggles between item-based and partner-based grouping.
- When enabled, the report groups rows by partner and shows sales, purchases, returns, and refunds associated with each customer or supplier.
- When disabled, the report returns to an item-level view where each row represents a specific item.
Arrow icons next to partner names indicate the transaction direction:
- A red upward arrow indicates a customer (sales flowing out)
- A blue downward arrow indicates a supplier (goods flowing in)
• In the
Profit Analysis tab, net profit is calculated using the item’s fixed purchase cost. • In the
Sales Summary tab, gross profit is based on actual purchase orders within the selected date range. The two numbers answer different questions and are not meant to match.How to Analyze Sales Data
A. Date Range & Period Comparison
BoxHero supports preset date ranges (today, last week, this month) alongside a custom date option. The custom range matters because sales activity rarely follows calendar boundaries.
A promotion that runs from the 15th through the 28th needs to be reviewed on those exact dates, not diluted across a full month.
Period-over-period comparison helps separate real change from normal variation. A short-term increase in sales does not carry the same meaning across all months. Many retail businesses experience predictable seasonal shifts, which can make certain periods appear stronger than they actually are when viewed in isolation.
Comparing equivalent periods from different years provides a more reliable reference point. If January 2025 sales were $45,000 and January 2026 sales were $52,000, that 15.6% increase represents actual growth measured against the same seasonal conditions, not calendar timing.
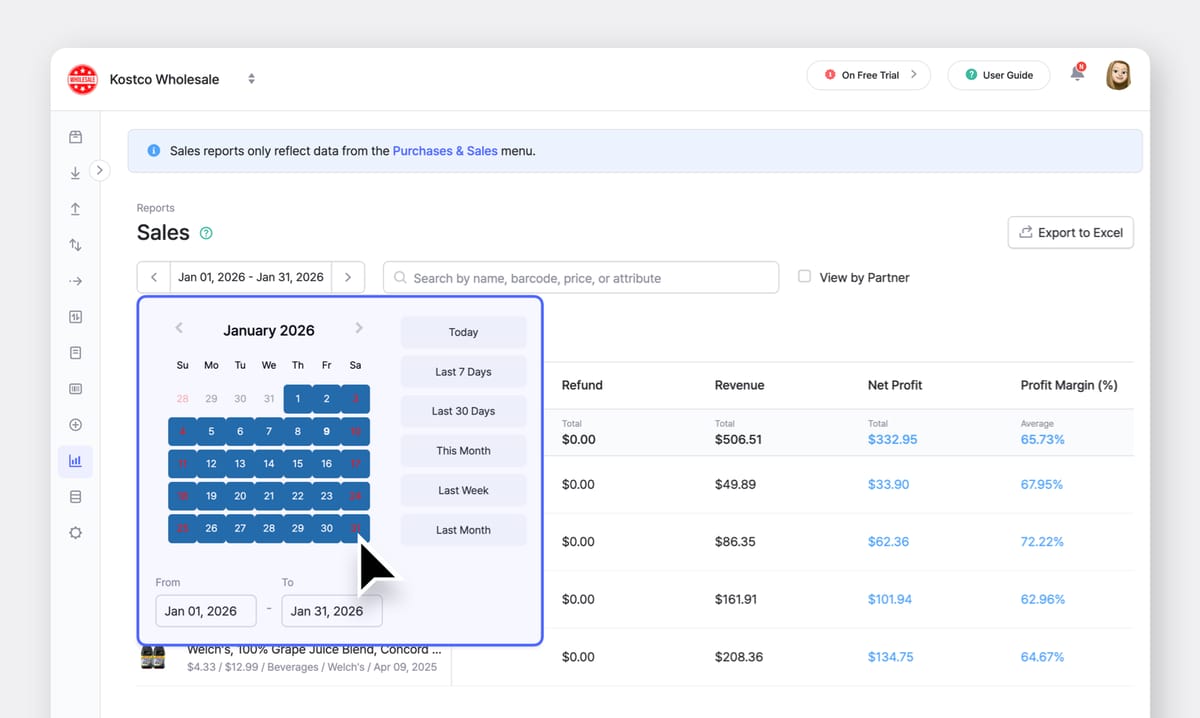
➤ In the Sales Summary tab, this comparison is typically used to review overall sales, purchases, and returns across periods.
➤ In the Profit Analysis tab, narrowing the date range helps isolate pricing changes, margin shifts, or short-lived sales activity that would be harder to spot in longer timeframes.
B. Item-Level Performance Metrics
Item-level analysis is centered in the Profit Analysis tab. Each row represents a single item and shows total quantity sold and total sales amount for the selected period, along with profit-related figures.
This view helps answers practical questions such as:
- Which items sell most frequently?
- Which items generated the most revenue despite lower sales volume?
For example:
- 500 units of Item A sold at $10 each results in $5,000 in sales
- 100 units of Item B sold at $75 each results in $7,500 in sales
Without seeing both figures side by side, it is easy to over-prioritize items based only on unit movement. BoxHero allows items to be sorted by total sales amount so you can identify which items contribute most during a given period.
For teams that want deeper review, this data can be exported to Excel as well.
C. Sales, Purchases, and Returns in One View
The Sales Summary tab is designed for reviewing transaction flow across a selected period rather than item-level pricing details.
This view aggregates sales quantity, sales amount, purchase quantity, purchase amount, return quantity, refunds, revenue, and gross profit for the selected period. When grouped by partner, it also helps show how activity is distributed across customers or suppliers.

Reviewing these figures together helps answer questions such as:
• Are returns concentrated in a specific timeframe?
• How much inventory was purchased relative to what was sold?
Conclusion
Sales reports turn individual transactions into a clear record of what actually moved, when it moved, and in what quantity. They provide the specific data needed to make purchasing decisions, identify slow-moving inventory, and understand which products deserve premium shelf space and marketing attention.
BoxHero's Sales Reports present this information directly from recorded sales and purchase activity, without relying on end-of-month processing or separate analytics software. The Profit Analysis and Sales Summary tabs offer two complementary views: one focused on item-level performance, and the other on overall sales, purchases, and returns across a period.
For teams already using BoxHero, sales reports work best when reviewed regularly as part of routine inventory checks. Short, consistent reviews make it easier to notice changes early and adjust purchasing or stocking decisions. 🙂
RELATED POSTS